Profile Line
The Line tool fits a line to the profile and measures the deviations from the best-fitted line. The tool also provides two “roughness parameter” measurements: Arithmetic Average and Rz. For a complete list of the measurements the tool provides, see Measurements.
For information on adding, managing, and removing tools, as well as detailed descriptions of settings common to most tools, see Tool Configuration.
Inputs
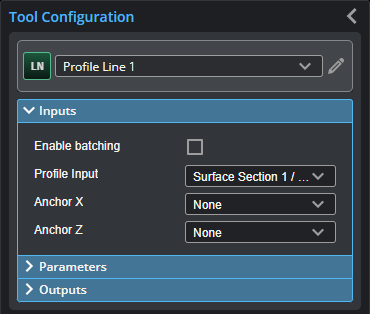
You configure the tool's inputs in the expandable Inputs section.

|
To use a measurement as an anchor, it must be enabled and properly configured in the tool providing the anchor. For more information on anchoring, see Measurement Anchoring. |
| Name | Description |
|---|---|
| Enable Batching |
For more information on arrays, batching, and aggregating, see Arrays, Batching, and Aggregation. |
|
Profile Input |
The data the tool applies measurements to or processes. This tool can optionally take an array as input. For more information, see Arrays, Batching, and Aggregation. |
|
Anchor X or Anchor Z |
The X or Z measurement of another tool that this tool uses as a positional anchor. Positional anchors are optional. |
Parameters
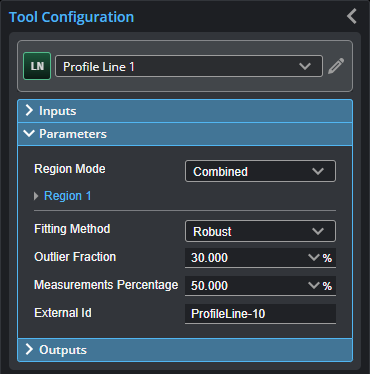
You configure the tool's parameters in the expandable Parameters section.
| Name | Description |
|---|---|
|
Region Mode |
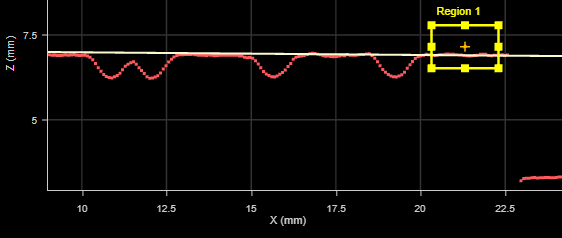
Whether the fitting and measurement regions are used, and whether they are combined or separate. One of the following: None The tool uses the entire profile both to fit the line and to perform measurements. Combined The tool uses a single, user-defined region to fit the line, in which it also performs measurements.
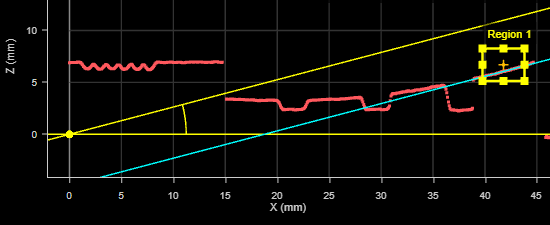
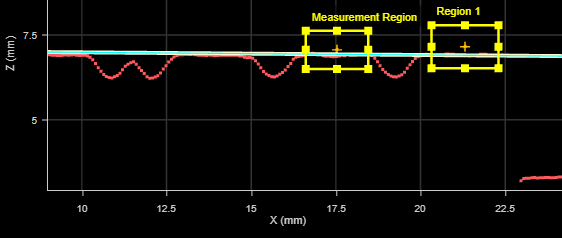
Separated The tool uses one or two regions to fit the line (selected using the Number of Regions parameter), and a single, separate region in which it performs measurements. (Offset and Angle measurements are related to the fitted line and are associated with the fitting region, rather than the measurement region.) In the following, the tool uses a single region to the left to fit the line, and performs measurements in the measurement region to the right:
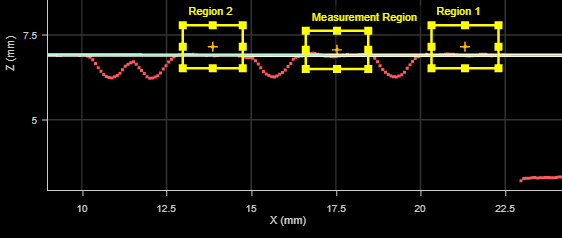
In the following image, the uses two regions to the left to fit the line, and performs measurements in the measurement region to the right:
|
|
Number of Regions |
When Region Mode is set to Separated, lets you choose the number of regions. |
|
Region {n} Measurement Region |
Use these expandable region sections to define the position and size of the fitting and measurement regions precisely. (Use the mouse to position and size them more roughly.) The number of region parameters displayed depends on the mode selected in Region Mode. |
|
Fitting Method |
Determines how the tool fits the line to the profile. One of the following: Simple Uses a less accurate but faster line-fitting method. Robust An iterative line-fitting method that removes points and attempts to fit a line until only the fraction set in Outlier Fraction of the original profile data points is left. More accurate but takes longer. When Fitting Method is set to Robust, set Outlier Fraction (see below). |
|
Outlier Fraction |
The fraction of outlier points to be removed during line fitting. Adjust this value based on how much noise is present in the profile. By default, 30%. Only displayed when Method is set to Robust. |
|
Measurements Percentage (Percentile measurement only) |
The specified percentage of points around the best-fitted line that the Percentile measurement uses. |
|
External ID |
The external ID of the tool that appears in GoHMI Designer. For more information, see GoHMI and GoHMI Designer. |
Outputs
All tools provide measurements, geometric features, or data as outputs.
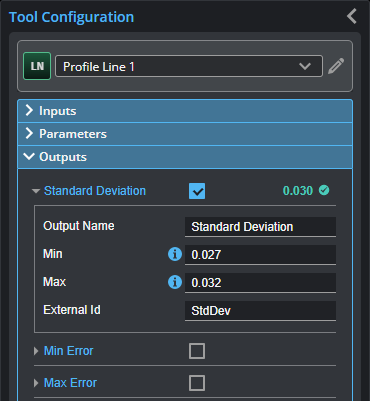
Outputs section with a measurement expanded to show user-configurable decision min/max fields and an external ID
You configure the Min and Max parameters by expanding the measurement in the Outputs section. In order for a measurement to return a Pass decision, the measurement must be between maximum and minimum values; the range is inclusive.


| Type | Description |
|---|---|
| Line |
The fitted line. |
| Min Error Point |
The point of minimum error. |
| Max Error Point |
The point of maximum error. |
|
|
For more information on geometric features, see Geometric Features. |