Health
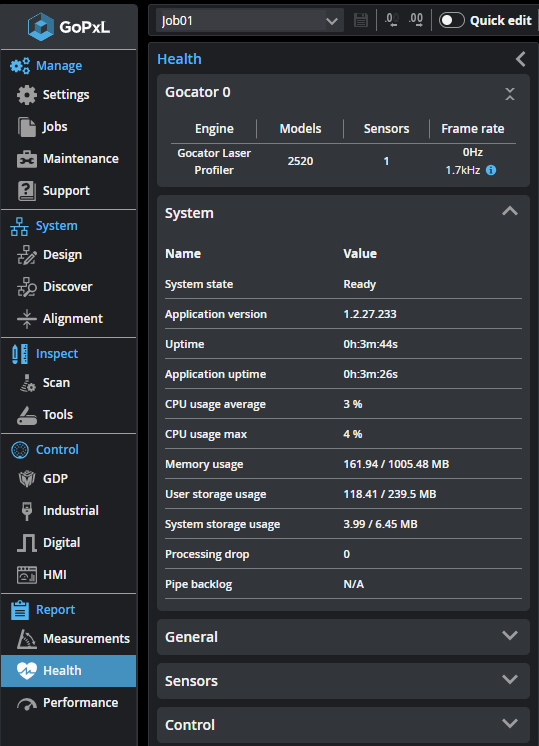
In the Health panel, you can monitor system, sensor group, and sensor health indicators, as well as various counters, such as processing drops.
The following tables list the information available in the Health panel.

|
When a sensor is being accelerated (by a PC instance of GoPxL or by GoMax), the value reported in the System section comes from the accelerator. However, only the following metrics are appreciably different from the physical device when accelerated: Uptime, CPU Usage, Memory Usage, and System/User Storage Usage. |
| Name | Description |
|---|---|
|
System state |
Current system state indicating whether the device is scanning or not. |
|
Application version |
System software version. |
|
Uptime |
Time since the system was power-cycled or reset. (If the sensor is accelerated by a PC or a GoMax accelerator, this is the uptime of the PC or GoMax.) |
|
Application uptime |
Time since GoPxL started. (On a PC, indicates how long the PC has been running.) |
|
CPU usage average |
Average system CPU usage for the system. |
|
CPU usage max |
Maximum system CPU usage for the system. |
|
Memory usage |
Sensor memory (MB used / MB total available). When a sensor is accelerated, this displays N/A. |
|
User storage usage |
Sensor flash storage (MB used / MB total available). When a sensor is accelerated, this displays N/A. |
| System storage usage | Non-volatile storage available (MB used / MB total available). |
|
Processing drop |
The sum of various indicators related to processing drops including drops due to insufficient CPU and buffer overflows. |
|
Pipe backlog |
Number of bytes queued for processing. |
| Name | Description |
|---|---|
|
Encoder value |
Current encoder value (ticks). |
|
Encoder frequency |
Current encoder frequency (Hz). |
|
Processing latency |
Last delay from camera exposure start to when the results are ready for output. |
|
Processing latency (Max) |
Peak delay from camera exposure start to when the results are ready for output. |
| Scan count | Number of scans performed since system state last changed to Running. |
| Scanner drops | Number of sensor group (scanner) drops. |
| Current speed | Current scanning frame rate. |
|
Trigger drops |
Count of camera frames dropped due to excessive trigger speed. |
| CUDA in use | With G3 sensors accelerated by PC or GoMax, indicates whether GoPxL is using CUDA. |
|
|
For each sensor in a system, GoPxL displays a table in the expandable Sensors section listing the health indicators for that sensor. |
| Name | Description |
|---|---|
| Master connected |
Whether the sensor is connected to a Master sensor networking hub. |
| Laser safety |
Whether Laser Safety is enabled. |
| Sensor uptime |
Time since the sensor was power-cycled or reset. |
|
CPU usage average |
Average system CPU usage for the sensor. |
|
CPU usage max |
Maximum system CPU usage for the sensor. |
|
Ethernet receive rate |
Rate at which data is being received by the sensor over Ethernet (Mbps). |
|
Ethernet send rate |
Rate at which data is being sent to the sensor over Ethernet (Mbps). |
|
Ethernet link speed |
Speed of the Ethernet link (Mbps). |
|
Memory usage |
Sensor memory usage (MB used / MB total available). |
|
User storage usage |
Sensor flash storage usage (MB used / MB total available). |
|
System storage usage |
Non-volatile storage available (MB used / MB total available). |
| Max spot count |
Maximum available spots, across all cameras. (G2) |
| Total exposure time | Total amount of time the laser light (G2), projector (G3), or light source (G5) has been turned on to make scans. |
| Internal temperature | Internal sensor temperature (degrees Celsius). |
| Laser driver temperature | Laser driver control temperature (degrees Celsius). (G2) |
| Light driver temperature | Light driver control temperature (degrees Celsius). (G4 / G5) |
| LED PCB temperature | LED PCB temperature (degrees Celsius). (G4 / G5) |
| External thermistor temp. | External thermistor temperature (degrees Celsius). (G4 / G5) |
| Projector illumination temp | Projector temperature (degrees Celsius) (G3). |
|
Trigger drops |
Count of camera frames dropped due to excessive trigger speed. |
|
Camera buffer drops |
Count of camera buffer drops due to excessive trigger speed. For G3, the buffer drops are shown for each camera. |
| Digital Output {n} drops | Count of digital output drops because the output signal could not be generated. |
| Digital Output {n} high count | Number of times the digital output line was set to high. |
| Digital Output {n} low count | Number of times the digital output line was set to low. |
| Name | Description |
|---|---|
| Gocator control drop |
The number of Gocator protocol drops. |