Profile Bridge Value
The Bridge Value tool calculates the "bridge value" and angle of a scanned surface. A bridge value is a single, processed range that is an average of a laser line profile that has been filtered to exclude user-definable portions of highs and lows in the profile. The resulting value represents a "roughness calculation." A bridge value is typically used to measure road roughness, but can be used to measure the roughness of any target.
The tool provides two additional measurements (Window and StdDev) that can help determine whether the scanned data is valid; for more information, see Measurements.

|
The Bridge value tool is only available when Uniform Spacing (in the Scan Mode panel on the Scan page) is unchecked, as the tool only works with unresampled data. For more information, see Uniform Data and Point Cloud Data. |
Understanding the Window and Skip Settings
The Bridge Value tool measurements work on a histogram of the ranges that make up the profile. The Window and Skip parameters together determine what segment of the heights in the histogram is used to calculate the bridge value. The following diagram illustrates the portion of the points of a histogram that would be included for calculating the bridge value, where Window is roughly 85% of the total points of the histogram, and Skip is roughly 15% of the points.

Profile point heights in the white area are included in the calculation of the average. Profile point heights in the grey area are excluded. By adjusting the Window and Skip parameters, you can exclude profile point heights that correspond to unwanted features on the target. In road roughness applications, for example, you could exclude rocks (profile points higher than the road surface), cracks or tining valleys (profile points lower than the road surface), and so on, to get an accurate representation of the tire-to-road interface.
For more information on parameters, see the Parameters table below.
For information on adding, managing, and removing tools, as well as detailed descriptions of settings common to most tools, see Tool Configuration.
Inputs
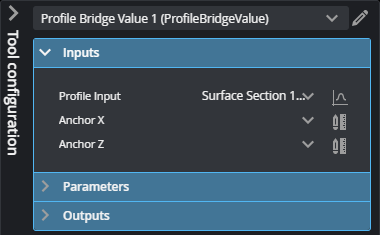
You configure the tool's inputs in the expandable Inputs section.
|
|
To use a measurement as an anchor, it must be enabled and properly configured in the tool providing the anchor. For more information on anchoring, see Measurement Anchoring. |
| Name | Description |
|---|---|
| Enable Batching |
For more information on arrays, batching, and aggregating, see Arrays, Batching, and Aggregation. |
|
Profile Input |
The data the tool applies measurements to or processes. This tool can optionally take an array as input. For more information, see Arrays, Batching, and Aggregation. |
|
Anchor X or Anchor Z |
The X or Z measurement of another tool that this tool uses as a positional anchor. Positional anchors are optional. |
Parameters
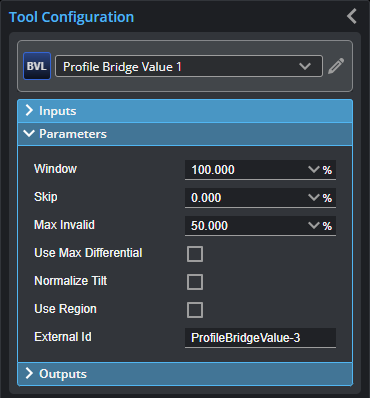
You configure the tool's parameters in the expandable Parameters section.
| Parameter | Description |
|---|---|
|
Window |
A percentage of the profile point heights in the histogram, starting from the highest point, to include in the average. For example, a setting of 50% would include the highest 50% of the heights. The Skip parameter then determines the actual portion of the profile point heights used to calculate the average. The Window setting in effect sets the lower limit of the profile point heights in the histogram to be used in the average. Use the setting to exclude lower parts of a profile that you do not want to include in the measurement. |
|
Skip |
A percentage of the profile point heights in the histogram, starting from the highest points, to exclude from the average. The Skip setting basically sets the upper limit of the profile point heights in the histogram to be used in the average. Use the setting to exclude higher parts of a profile that you do not want to include in the measurement. If Skip is greater than Window, an invalid value is returned. |
|
Max Invalid |
The maximum percentage of invalid points allowed before an invalid result is returned. |
| Use Max Differential | Enables the Max Differential parameter. See below. |
|
Max Differential |
The maximum difference between the maximum and minimum histogram values before an invalid measurement value is produced. |
| Normalize Tilt |
Fits a line to the profile and shears the points in the Z direction by the angle between the fitted line and the X axis. The Window and Skip settings are applied to the histogram of the transformed data. Useful for surfaces that are tilted. |
|
Use Region |
Enables the region settings. |
|
Region |
The region to which the tool's measurements will apply. For more information, see Regions. |
Outputs
All tools provide measurements, geometric features, or data as outputs.
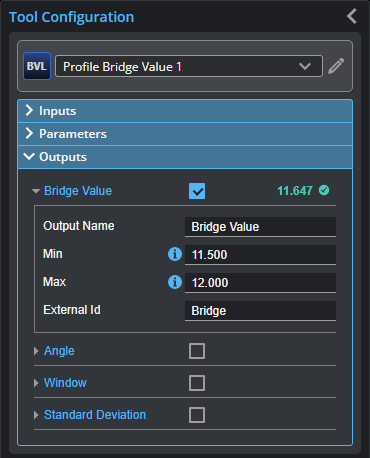
Outputs section with a measurement expanded to show user-configurable decision min/max fields and an external ID
You configure the Min and Max parameters by expanding the measurement in the Outputs section. In order for a measurement to return a Pass decision, the measurement must be between maximum and minimum values; the range is inclusive.
| Measurement | Illustration |
|---|---|
|
Bridge Value Determines the bridge value of the non-excluded part of the profile. |
|
|
Angle Determines the angle of the line fitted to the profile. When Normalize Tilt is unchecked, the measurement always returns 0. |
|
|
Window Returns the height of the area on the profile resulting from the Window and Skip settings. If you are using this measurement on a Gocator 2342 sensor, see Profile Bridge Value for more information. |
|
|
StdDev Returns the standard deviation of the data in the area on the profile resulting from the Window and Skip settings. If you are using this measurement on a Gocator 2342 sensor, see Profile Bridge Value for more information. |


