Surface and Perspective Display Options
You control how Surface data displays when the data viewer is in Surface or Perspective mode using the display options available in the Display Outputs panel. To access the display options, open the Display Outputs panel and click the rightmost icon of the output you are working with.
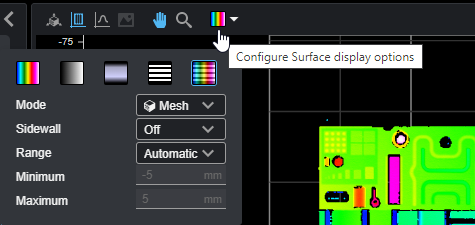
Surface display options.
| Option | Description |
|---|---|
|
Display options |
The output display modes let you choose how GoPxL shades the Surface data when the data viewer is in Surface mode or in Perspective mode.
The following output display modes are available:
Heightmap Heightmap mode (
Grayscale Grayscale mode (
Uniform Uniform mode (
Intensity Intensity mode ( When intensity data is enabled on the Acquire > Scan page, sensors produce intensity images that measure the amount of light reflected by an object. An 8-bit intensity value is output for each data point in the scan data, where a darker shade represents a smaller value and lighter shade represents a larger value. The sensor applies the same coordinate system and resampling logic as the ranges to the intensity values. For more information, see Scan Modes and Intensity.
Heightmap + Intensity Heightmap + Intensity mode (
|
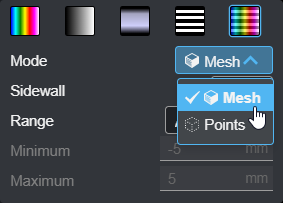
| Mesh and Points modes |
You can choose whether the data viewer displays Surface data as a mesh or points. Note that the data viewer Mesh mode is unrelated to the Mesh data type. (For information on the Mesh data type, see Mesh Measurement.)
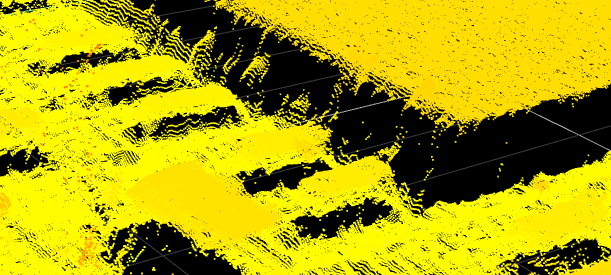
Points mode displays the data as discrete data points. This mode is useful in scan data that contains noise around edges, and can show hidden structure.
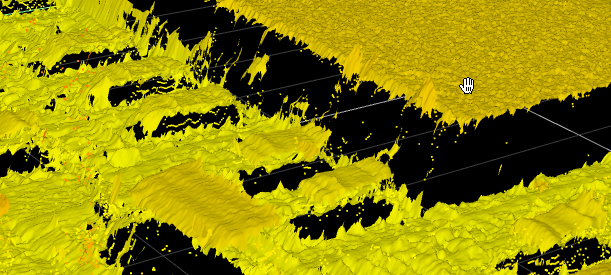
Mesh mode displays Surface data by connecting the data points with polygons.
|
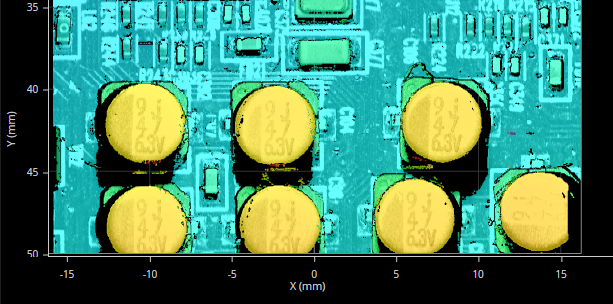
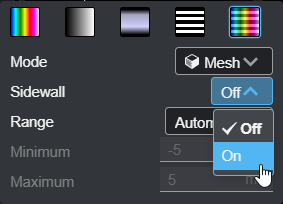
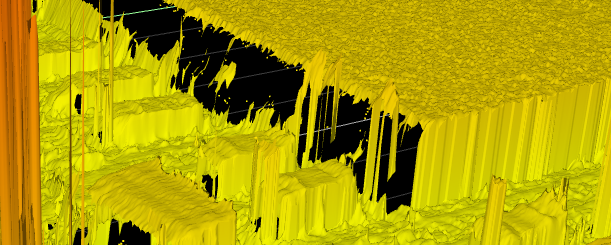
| Sidewall mode |
You can toggle the data viewer between hiding and showing polygons which are vertical or nearly vertically oriented. This can produce a more realistic-looking part for demonstrations.
For example, in the following, the sidewalls are enabled, resulting in the lines shown at the edges of the PCB components.
Note that this setting only affects the appearance of scan data in the data viewer. It does not change the scan data and therefore does not affect measurements. |
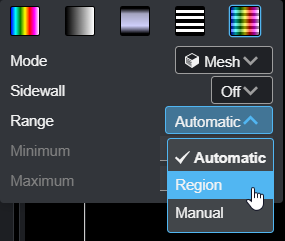
| Heightmap scaling |
The data viewer displays heightmap information in pseudo-color or grayscale. The height axis (Z) is color-coded in the legend to the right in the data viewer. You can adjust the scaling of the height map. To change the scaling, choose an option from Range.
Do one of the following:
|

 ) displays a color heightmap over the Surface data. A heightmap legend is displayed in the data viewer. You can set the range values that map to the heightmap colors to make features easier to see.
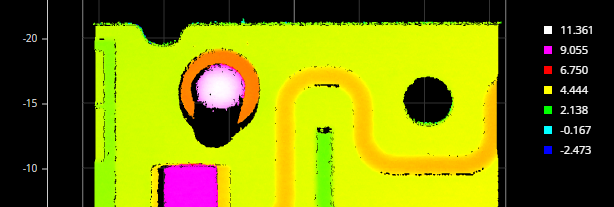
 ) displays a grayscale heightmap over the Surface data. Working in grayscale mode can make it easier to distinguish the scan data from tool visualizations. A heightmap legend is displayed in the data viewer. You can set the range values that map to the heightmap colors to make features easier to see.
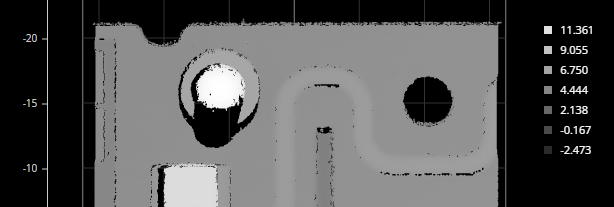
 ) displays a uniform gray color over the Surface data. This mode is mostly useful when you want to focus on shape or geometry.
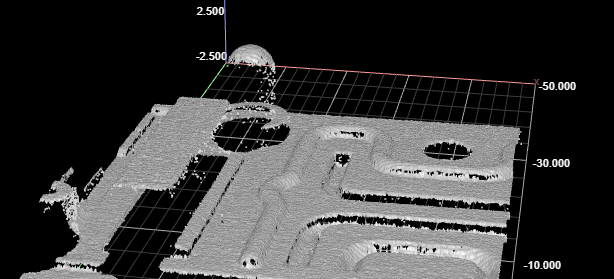
 ) displays intensity data over the Surface data if it is available.
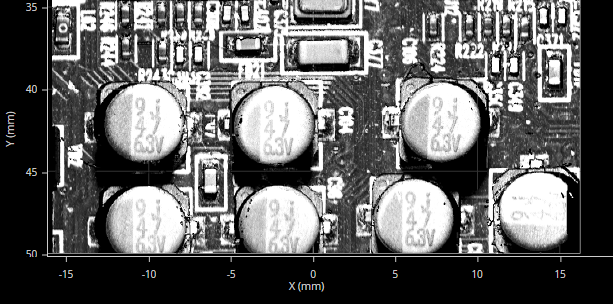
 ) displays a color heightmap combined with intensity data on the Surface data. You must enable intensity data before scanning for this mode to be available. For more information, see