User Interface Overview
You configure sensors using GoPxL by connecting to an IP address with a web browser.
If you are running GoPxL on-sensor, in the browser, you connect to the IP address of the sensor. By default, the IP address of Gocator sensors is 192.168.1.10.
If you are running the Windows-based GoPxL application (to accelerate the sensor on a PC or view previously recorded scans), in the browser, by default you connect to the localhost address (127.0.0.1). For more information on running GoPxL on a PC, see Running GoPxL on a Windows PC.
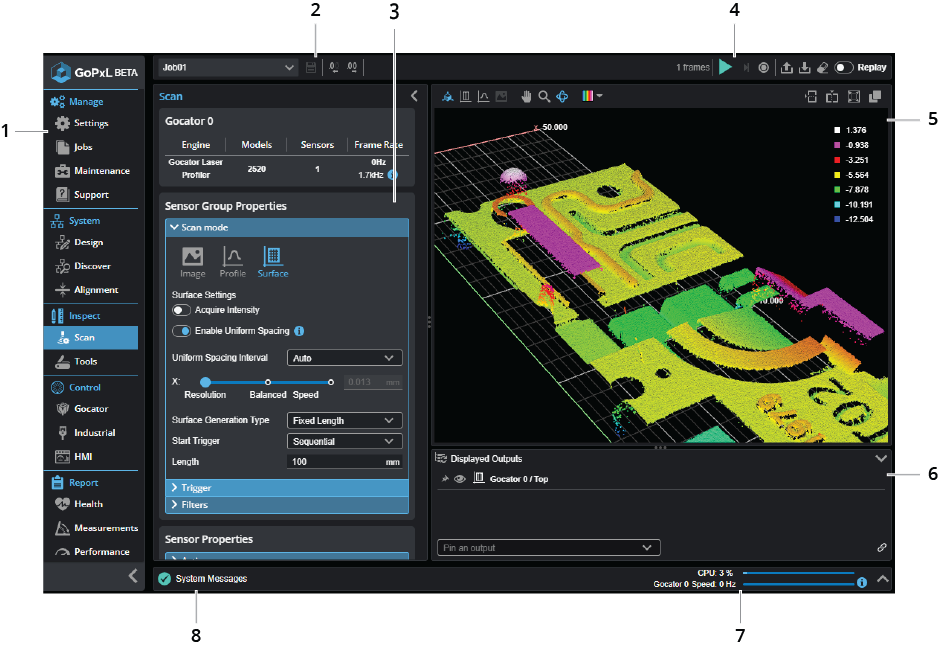
GoPxL provides categories in a vertical navigation bar on the left of the interface that group similar functions together in pages. Each page contains one or more panels that further categorize functionality. Generally speaking, the order of the categories and the pages reflects the workflow involved in configuring systems for an application for the first time, from the top down.

|
Some UI screenshots in this manual may not depict the latest version of GoPxL. These screenshots will be updated soon. |
| Element | Description | |
|---|---|---|
|
1 |
Navigation bar |
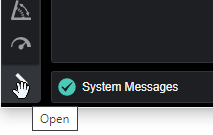
The navigation bar (sometimes called the "nav" bar) along the far left of the user interface displays categories (for example, from the top, Manage, System, Inspect, and so on), which contain one or more configuration pages (for example, the Manage category contains the Settings and Jobs pages, among others). Each page contains one or more panels. The category and page currently selected in the navigation bar are highlighted. In this manual, we often use a shorthand convention to describe the location of a page, such as "Inspect > Tools page." By default, the navigation bar is collapsed and only shows the category and page icons. When you move the mouse pointer over the navigation bar, it expands temporarily to show the category and page names. To pin the navigation bar open, click the Open button at the lower left of the interface:
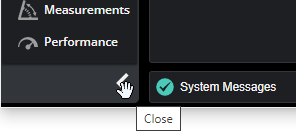
To unpin the navigation bar, click the Close button at the lower left of the interface.
For information on the categories and what you can do with the pages they contain, see What you can do in the categories. |
| 2 | Job-related functions | These controls let you work with jobs, for example, creating and saving jobs. For more information on jobs, see Jobs. |
| 3 | Configuration area | This area contains the configurations of the selected page and panel. When configuring tools, an additional Tools Configuration panel lets you configure a tool's parameters. |
| 4 | Scan controls | These controls let you start and stop scanning, and also work with replay data. For information on starting and stopping scanning, see Starting, Stopping, and Recording. For information on working with replay data, see Playing Back Recorded Data. |
| 5 | Data viewer | The data viewer (sometimes called the data visualizer) displays scan data, providing several tools in its toolbar to control how data is visualized (such as top view, front view, or perspective view). The data viewer is available on all pages. You can split it horizontally and vertically, and create pop-out windows. For more information, see Data Viewer. |
| 6 | Displayed outputs pane | This area lets you show, hide, and pin outputs such as measurements. You can also control how outputs are displayed. For more information, see Pinning Outputs. |
| 7 | Metrics area | This area provides CPU usage and frame rate, including the calculated maximum frame rate. For more information, see Metrics Area. |
| 8 | System messages | This area provides log messages, error alerts and warnings. For more information, see System Messages. |
The following lists the categories available in GoPxL and where you can learn how to work with them.
| Category | Description |
|---|---|
|
Manage |
Lets you configure network settings, manage jobs, upgrade sensors or perform a factory restore, and so on. For more information, see Sensor Management and Maintenance. |
| System | Lets you design and align sensor systems. For more information system design, see Creating a Sensor System. |
| Inspect |
Lets you do the following:
|
| Control |
Lets you enable and configure the Gocator communication protocol and industrial protocols. For more information, see Configuring Control. For information on the protocols, see Integrations. |
| Report | Lets you monitor measurements, as well as sensor health and performance. For more information, see Reporting. |