Displaying and Pinning Outputs
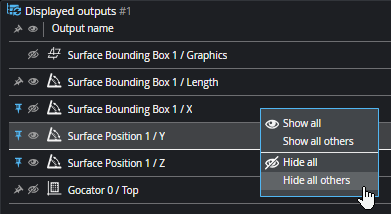
You can interact with the inputs, outputs, and other elements listed in the Displayed Outputs panel to control what you see in the data viewer window, by pinning or hiding outputs. This makes it easier to configure and monitor your application. When you select a block (a tool or the sensor / source at the top) in the Tool Diagram panel, the Displayed Outputs panel lists items related to the currently selected tool. By default, the panel lists all of the selected tool's inputs, the currently selected output of that tool, any pinned outputs, and tool-related graphics. In addition to selectively pinning or hiding outputs, you can right-click on an output in the panel to access "show / hide all" options.
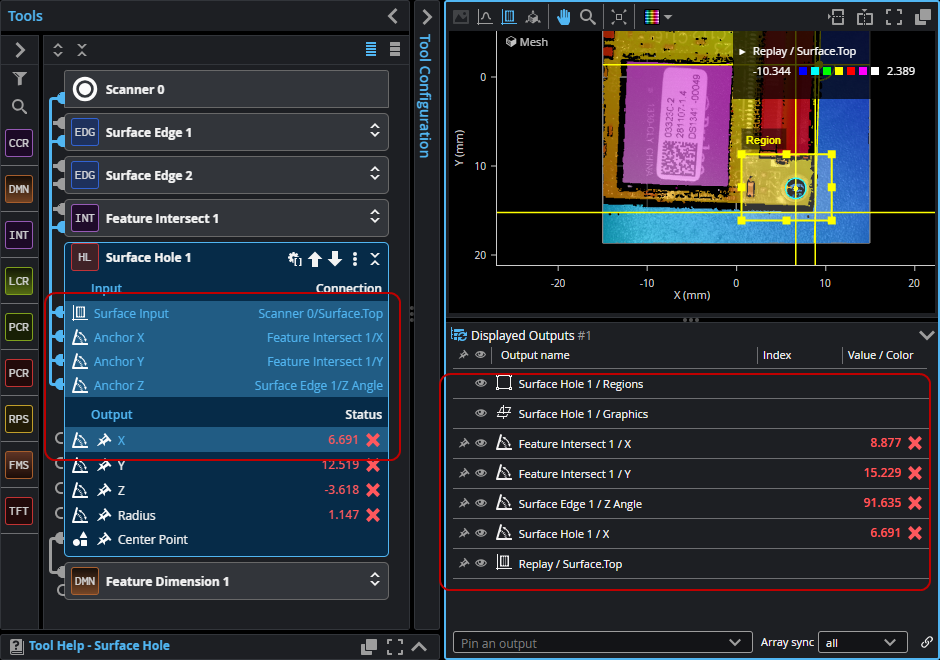
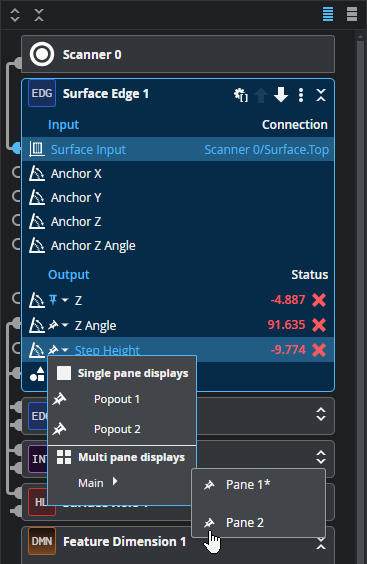
In the following image, the Feature Dimension tool is selected, indicated by the block's blue border and background. The inputs and outputs highlighted with a darker background in the tool block on the left, as well as tool elements (regions and graphics) are listed in the panel on the right.
If you select an input in a tool block, only that input is displayed: the other inputs are removed from the list and are not displayed in the data viewer window. This means that clicking an input such as an anchor deselects all other inputs, including the tool's input scan data. To keep the tool's input scan data visible, you can pin it (see below). After selecting an individual input, if you then click the top of the tool block (on the tool name or next to that), all of the inputs are again selected and listed in the panel.
You can “pin” items in the Displayed Outputs panel so that it they are always displayed, even if you select a different tool, or another input or output in a tool block. Pinning items is useful for example if you want to monitor multiple, independent measurements while GoPxL is running in production. Pinning is also useful when setting up tools: you can change the parameters of a tool (such as a filter) earlier in a tool chain and immediately see the impact that change has on another tool (whose output is pinned) later in the chain. This minimizes toggling and clicking between tools and measurements.
You pin items in either the Displayed Outputs panel or the tool's block in the Tool Diagram. Pinned outputs are identified in GoPxL by a vertical blue "thumbtack" icon. Unpinned outputs are identified by a grey thumbtack icon. (See below.)
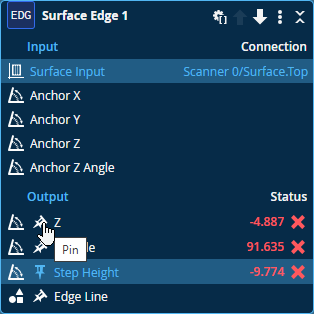
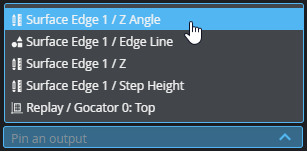
Pinning an output in the Tool Diagram.
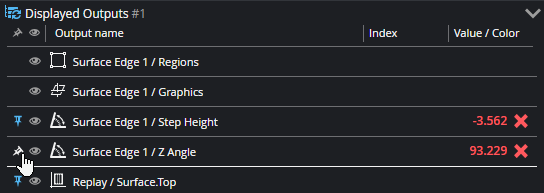
Pinning an output in the Displayed Outputs panel.
You can also choose an item from the "Pin an output" menu at the bottom of the panel.
If you have created additional data viewers, either by splitting a data viewer in the main browser window, or by popping out a new data viewer, you can choose which data viewer to pin an output to in the Tool Diagram panel. (For information on creating and using new data viewers, see Using Multiple Data Viewers.)
"Single pane displays" are data viewers you've created using the "Pop out" button ( ), which display in a new browser window.
"Multi pane displays" are data viewers you've created using one of the "split" buttons ( or
or  ). The pane identified by an asterisk is the original data viewer, the one from which you created others.
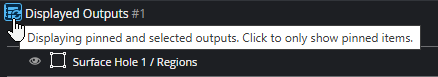
You can control whether a data viewer displays both pinned and selected inputs / outputs, or instead only pinned outputs. Displaying only pinned outputs lets you focus on those inputs and outputs in the data viewer while configuring or monitoring your application. You toggle between these modes by clicking the Synchronize pane button ( ) at the top of the Displayed Outputs panel.
By default, this is enabled in the main data viewer, and disabled in any pop-out or split data viewers you create. Note that if there are no pinned outputs in any of the tools in your job, and you disable pane synchronization, the Displayed Outputs panel will be empty and nothing will be displayed in the data viewer.
When you are working with arrayed outputs, you can select an array element for display across all arrayed outputs listed in the Displayed Outputs panel. For example, in the following, we see all five objects in an arrayed output displayed. For each element, Bounding Box tool graphics and X and Y measurements, as well as the Surface Blob output.
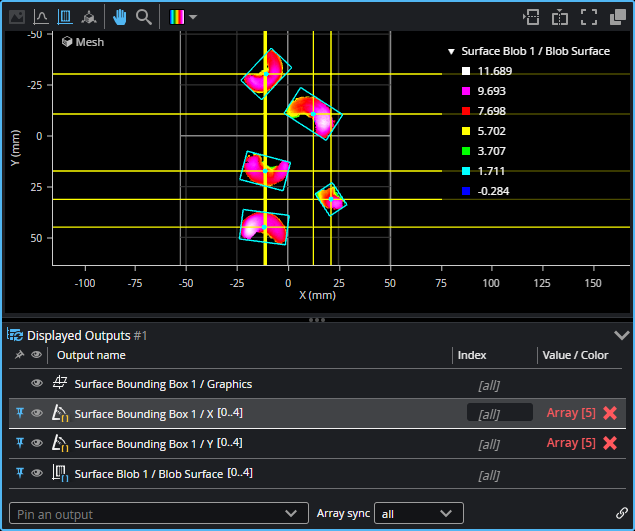
If you want to focus on a single element, you can choose that element in the Array sync drop-down.
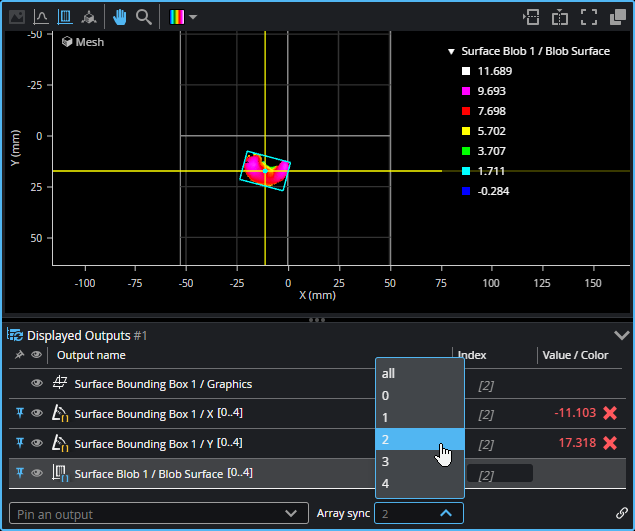
Note that the default is to display all elements.