Script Tool
The Script tool executes a user-defined Python-based script.
For a list of the tool's supported classes and methods, see Functions and Classes.
For examples, see Examples.
The tool supports all GoPxL data types as input and output:
- Surface, Profile, Image, and Mesh data; intensity data is available with Surface and Profile data
- Measurements (values and decisions, and anchor sources for other tools)
- Strings
- Geometric features
- Arrays of the supported types

|
The Script tool does not support writing files when it is running on a sensor or GoMax NX device, and will display a permissions error if you attempt this. Writing to files is only supported when the tool is running on a PC instance of GoPxL. When writing to files, you should explicitly set the path to a writable location. |
The tool does not support using print(), sys.stdout, or Python's logging module functions to send messages to GoPxL’s system log. Instead, use one of the “log_” functions. For more information, see Logging.
Script tools are added, configured, and removed like other measurement tools.
|
|
The Script tool uses Python version |
For information on adding, managing, and removing tools, as well as detailed descriptions of settings common to most tools, see Tool Configuration.
Included Python Modules
In addition to the standard Python library modules, the tool also includes the NumPy 1.19 module. NumPy is useful for operating on arrays.
On Windows, you can install additional modules with pip by running the following command under the bin\win64\python folder in the main GoPxL folder:
python3.exe -m pip install <modulename>
Note that for some libraries you may need to specify a specific version to ensure compatibility with the version of Python included with GoPxL.
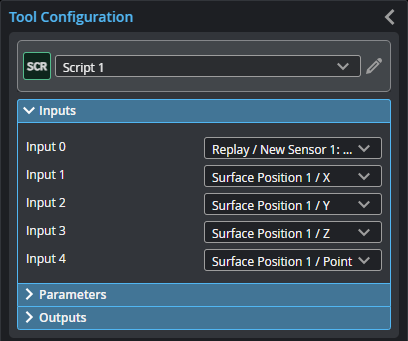
Inputs
You configure the tool's inputs in the expandable Inputs section.
| Name | Description |
|---|---|
|
Input {n} |
Selects the input for the script where {n} is the index of the input. All input types are allowed. Input cannot be ‘None’. In the get_ functions' index parameters, use this index. The Number of inputs parameter (see below) determines the number of inputs. This tool can optionally take an array as input. For more information, see Arrays, Batching, and Aggregation. |
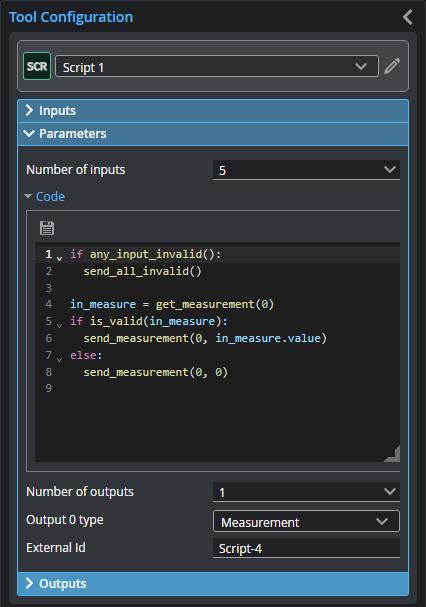
Parameters
You configure the tool's parameters in the expandable Parameters section.
| Name | Description |
|---|---|
| Number of Inputs |
Specifies the number of inputs needed in the script. |
|
Code |
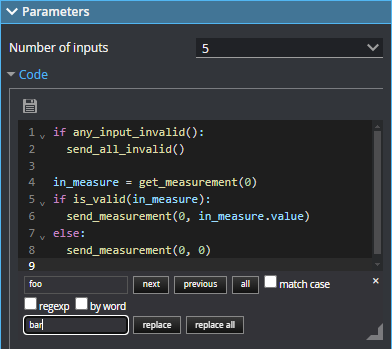
The Python code the tool runs. Supports expanding and collapsing of code blocks. You can resize the editor vertically with the grabber to the lower left of the editor. You can resize the width of the editor by resizing the Tool Configuration panel. The following keyboard shortcuts are available in the editor. Ctrl-S: Saves the script. The tool checks the syntax. Use Cmd-S on macOS. Ctrl-F: Opens a search and replace panel. The search and replace panel supports regular expressions. Use Cmd-F on macOS. To close the panel, click the "x" to the upper right.
Ctrl-D: Highlights all occurrences of the word under the cursor. Each time you press Ctrl-D after that, the cursor moved to the next occurrence. Use Cmd-D on macOS. Alt-ArrowLeft / Alt-ArrowRight: Move the cursor over the next element to the left or right, respectively. Alt-ArrowUp / Alt-ArrowDown: Move the selected lines up or down one line, respectively. Combining this with Shift copies lines instead. Ctrl-/: Toggles commenting. Use Cmd-/ on macOS. Ctrl-[ / Ctrl-]: Decreases or increases the indentation of the selected line. Use Cmd-[ or Cmd-] on macOS. |
|
Number of outputs |
Specifies the number of outputs the script produces. |
| Output {n} type | Selects the output type for each output, where {n} is the index of the output. |
|
External ID |
The external ID of the tool that appears in GoHMI Designer. For more information, see GoHMI and GoHMI Designer. |
Outputs
Most tools provide measurements, geometric features, or data as outputs.
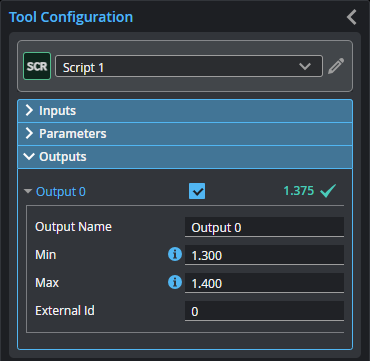
To set whether measurement values are considered a Pass or Fail, select a measurement in the outputs list, and then enable and configure its Min and Max parameters in the Output Properties section; you can enable one or the other, or both.
By default, Min and Max are both disabled, and a measurement is considered a Pass.
| Measurement |
|---|
|
Output {n} Output from the Python script, where {n} is the index of the output. The number of outputs and the type of each output is determined by the Number of outputs and Output type {n} parameters, respectively. |
Functions and Classes
Getting Input
The following Python functions are available for performing input operations and testing input validity.
The index of the input is given as an argument. If the input at the index is missing or it is the wrong type, None is returned. Functions will return an array if input is an array.
For information on the returned types, see Data Structures.
| Function | Description |
|---|---|
| is_valid(obj) |
Checks whether the object is valid or not. |
| get_surface(index) |
Gets a surface message or array of messages from the specified input. |
| get_profile(index) |
Gets a profile message or array of messages from the specified input. |
| get_measurement(index) |
Gets a measurement message or array of messages from the specified input. |
| get_point(index) |
Gets a point message or array of messages from the specified input. |
| get_circle(index) |
Gets a circle message or array of messages from the specified input. |
| get_plane(index) |
Gets a plane message or array of messages from the specified input. |
| get_line(index) |
Gets a line message or array of messages from the specified input. |
| get_image(index) |
Gets an image message or array of messages from the specified input. |
| get_string(index) |
Gets a string or array of strings from the specified input. |
| get_mesh(index) |
Gets a mesh message or array of messages from the specified input. |
Drawing Graphics
The Python functions listed below are available for drawing graphics in the data viewer. The default values used in draw() functions are as follows:
GRAPHIC_DEFAULT_SIZE = 5
GRAPHIC_DEFAULT_COLOR = Colors.CYAN
| Function | Description |
|---|---|
| draw_points(points, color = GRAPHIC_DEFAULT_COLOR, size = GRAPHIC_DEFAULT_SIZE, shape = MarkerShape.CIRCLE, output = None) |
Draw points with customizable size, shape and color. |
| draw_lines(points, color = GRAPHIC_DEFAULT_COLOR, width = GRAPHIC_DEFAULT_SIZE, hasStartPointArrow = False, hasEndPointArrow = False, output = None) |
Draw graphic lines with customizable width and color. |
| draw_region(points, center, dimensions, angle, output = None) |
Draw region with customizable dimensions. |
| draw_label(text, position, output = None) |
Draw label with customizable location. |
| draw_plane(normal, distance, output = None) |
Draw plane with customizable normal and distance. |
| draw_ray(position, direction, width = GRAPHIC_DEFAULT_SIZE, color = GRAPHIC_DEFAULT_COLOR,, output = None) |
Draw points with customizable size, shape and color. |
Sending Output
The following Python functions are available for performing output operations.
The index of the output is given as an argument.
For information on the output types, see Data Structures.
| Function | Description |
|---|---|
| is_output_enabled(index) |
Checks whether the output at the specified index is enabled. |
| send_surface(index, offset, scale, points, intensity=None, is_adjacent=None, header=None) |
Sends a surface message or array of messages to the specified output. |
| send_profile(index, offset, scale, points, intensity=None, slices=None, header=None) |
Sends a profile message or array of messages to the specified output. |
| send_measurement(index, value, label_position=None, header=None) |
Sends a measurement message or array of messages to the specified output. Note that the decision can’t be set with this function because the decision of a measurement is only set after output using the Min and Max thresholds on the outputs. |
| send_point(index, position, header=None) |
Sends a point message or array of messages to the specified output. |
| send_line(index, position, direction, header=None) |
Sends a line message or array of messages to the specified output. |
| send_circle(index, position, normal, radius, header=None) |
Sends a circle message or array of messages to the specified output. |
| send_plane(index, normal, origin_distance, header=None) |
Sends a plane message or array of messages to the specified output. |
| send_image(index, pixels, pixel_format= PixelFormat.MONO_8, flipped_x=False, flipped_y=False, transposed=False, header=None) |
Sends an image message or array of messages to the specified output. |
| send_string(index, string, position = None, decision = None, header=None) |
Sends a string or array of strings to the specified output. |
| send_mesh(index, vertex_data, facet_data, vertex_normal_data = None, facet_normal_data = None, vertex_texture_data = None, data_offset = None, data_range = None, header=None) |
Sends a mesh message or array of messages to the specified output. |
Logging
Logging a message causes GoPxL to add a message to the log at the bottom of the user interface. There are three types of log messages.
| Function | Description |
|---|---|
| log_info(msg) |
Logs a user informational message. |
| log_warning(msg) |
Logs a user warning message. |
| log_error(msg) |
Logs a user error message and displays a pop-up containing the message. |
Memory
You can use a Script tool's memory dictionary for storing values during runtime. The dictionary is erased when scanning starts.
|
|
Some classes are only available through the tl namespace (for example, tl.Anchor3d). These classes are indicated below. |
Data Structures
| Data Structure | Description |
|---|---|
| Region |
2D Region box (center-based). |
| Region3d |
3D Region box (center-based). |
| Rect3d |
3D rectangular region box. |
| tl.Anchor3d |
3D anchor (center-based). Use the Anchor3d class to receive anchor information as input. For anchor outputs, use Measurement outputs instead. This class is only accessible through the tl namespace (tl.Anchor3d). |
| Point |
2D Point class. |
| Point3d |
3D Point class. |
| tl.Stamp |
Represents acquisition metadata associated with a data message. Note that width, height, x, and y parameters refer to the dimensions of the camera image; for more information, see points in tl.SurfaceMsg. |
| Transform3d |
3D transform matrix. |
| tl.MsgHeader |
Header class of data message. |
| PixelFormat |
Enum class of pixel formats for image data message.
Mono formats MONO_8 = <PixelFormat.MONO_8: 0x0001> MONO_10 = <PixelFormat.MONO_10: 0x0003> MONO_12 = <PixelFormat.MONO_12: 0x0005> MONO_14 = <PixelFormat.MONO_14: 0x0025> MONO_16 = <PixelFormat.MONO_16: 0x0007>
RGB formats RGB_8 = <PixelFormat.RGB_8: 0x0014> BGR_8 = <PixelFormat.BGR_8: 0x0015> RGB_10 = <PixelFormat.RGB_10: 0x0018> BGR_10 = <PixelFormat.BGR_10: 0x0019> RGB_12 = <PixelFormat.RGB_12: 0x001A> BGR_12 = <PixelFormat.BGR_12: 0x001B> RGB_14 = <PixelFormat.RGB_14: 0x005E> BGR_14 = <PixelFormat.BGR_14: 0x004A> RGB_16 = <PixelFormat.RGB_16: 0x0033> BGR_16 = <PixelFormat.BGR_16: 0x004B>
YUV/YCBR formats Y_CB_CR_8_CB_Y_CR = <PixelFormat.Y_CB_CR_8_CB_Y_CR: 0x003A> Y_CB_CR_411_8_CB_YY_CR_YY = <PixelFormat.Y_CB_CR_411_8_CB_YY_CR_YY: 0x003C> Y_CB_CR_422_8_CB_Y_CR_Y = <PixelFormat.Y_CB_CR_422_8_CB_Y_CR_Y: 0x0043>
Bayer formats BAYER_GR8 = <PixelFormat.BAYER_GR8: 0x0008> BAYER_RG8 = <PixelFormat.BAYER_RG8: 0x0009> BAYER_GB8 = <PixelFormat.BAYER_GB8: 0x000A> BAYER_BG8 = <PixelFormat.BAYER_BG8: 0x000B> BAYER_GR10 = <PixelFormat.BAYER_GR10: 0x000C> BAYER_RG10 = <PixelFormat.BAYER_RG10: 0x000D> BAYER_GB10 = <PixelFormat.BAYER_GB10: 0x000E> BAYER_BG10 = <PixelFormat.BAYER_BG10: 0x000F> |
| tl.ImageMsg |
ImageMsg class for image data message. |
| UnitType |
Enum class of units for spatial dimensions.
NONE = <UnitType.NONE: 0> MILLIMETER = <UnitType.MILLIMETER: 1> PIXEL = <UnitType.PIXEL: 2>
|
| tl.SurfaceMsg |
SurfaceMsg class for surface data message. |
| tl.ProfileMsg |
ProfileMsg class for profile data message. |
| tl.MeasureMsg |
MeasureMsg Class for measurement data message. |
| MeasurementDecision |
Enum class of decision type for measurement data message.
FAIL= <MeasurementDecision.FAIL: 0> PASS= <MeasurementDecision.PASS: 1> |
| tl.PointFeatureMsg |
PoinFeaturetMsg class for point feature message. |
| tl.LineFeatureMsg |
LineFeatureMsg class for line feature message. |
| tl.CircleFeatureMsg |
CircleFeatureMsg class for circular feature message. |
| tl.PlaneFeatureMsg |
PlaneFeatureMsg class for planar feature message. |
| tl.StringMsg |
StringMsg class. |
| tl.MeshMsg |
Sends a mesh message or array of messages to the specified output. |
| MarkerShape(Enum) |
Marker shape types for graphics. CROSS = 0 PLUS = 1 CIRCLE = 2 SQUARE = 3 TRIANGLE = 4 DIAMOND = 5 |
Examples
Expand for a list of examplesThe following example shows how to read a measurement value input and output a new measurement value that is equal to the input multiplied by a factor of two.
# Get the measurement object at input 0
measurement = get_measurement(0)

# Extract the value from the measurement
measurement_value = measurement.value

# Calculate a new measurement value
measurement_output = 2 * measurement_value

# Send the calculated value as a new measurement to output 0
send_measurement(0, measurement_output)
The following example shows how to read measurement value inputs and write them to a CSV file. (This example is only intended for use on a PC instance of GoPxL, as writing to files on-sensor or on a GoMax device is blocked.)
import csv

# Get measurement objects
measurement_1 = get_measurement(0)
measurement_2 = get_measurement(1)

# Extract values from measurement objects
measurement_1_value = measurement_1.value
measurement_2_value = measurement_2.value

# Path to the output CSV file
output_path = r'C:\GoTools\Script\measurement.csv'

# Write measurements to CSV file
with open(output_path, 'a') as f:
    writer = csv.writer(f)
    writer.writerow([measurement_1_value, measurement_2_value])
You can access mathematical operations through the standard Python math module.
# Import the math module to access mathematical functions
import math

# Get the measurement object at input 0
measurement = get_measurement(0)

# Extract the value from the measurement
measurement_value = measurement.value

# Calculate the square root of the absolute value using the Math module
sqrt_value = math.sqrt(math.fabs(measurement_value))

# Send the square root as a new measurement to output 0
send_measurement(0, sqrt_value)
Accessing valid/invalid and decision pass/fail
You can use the is_valid() function of the MeasureMsg class to check whether the value is valid or invalid. An invalid measurement is represented by the value numpy.nan. Other input classes also have is_valid() functions, which return true if the object data is not null.
The pass/fail criteria for the input MeasureMsg can be checked using the decision member variable.
# Check if any inputs are invalid
if any_input_invalid():
    send_all_invalid()

# Get the input measurement
measurement0 = get_measurement(0)

# Access validity from a measurement
if is_valid(measurement0):
    log_info("The input measurement is Valid")
else:
    log_info("The input measurement is Invalid")

# Access decision from a measurement
if measurement0.decision == MeasurementDecision.PASS:
    log_info("The input measurement has a Pass decision")
else:
    log_info("The input measurement has a Failed decision")
Smoothing / moving average of measurement values
This script shows how to use the memory feature to implement a smoothing filter / moving average of measurement values. Values from each frame are stored in the memory and with each new frame the oldest item is removed from memory before calculating the average.
import numpy as np

measurement_1 = get_measurement(0)
new_value = measurement_1.value
#log_info(f'Measurement values: {new_value}')

class MovingAverage:
    def __init__(self, window_size=10):
        self.window_size = window_size

    def add_value(self, value):
        memory.setdefault("Values", []).append(value)
        if len(memory["Values"]) > self.window_size:
            memory["Values"].pop(0)
        return self.calculate_average()

    def calculate_average(self):
        if len(memory["Values"]) == 0:
            return np.nan  # if no value present
        return np.mean(memory["Values"])

moving_avg = MovingAverage(window_size=10)
avg = moving_avg.add_value(new_value)
# log_info(f'Avg: {avg}')

send_measurement(0, avg)
profile = get_profile(0)

stamp = profile.header.stamp

log_info('Stamp = {}'.format(vars(stamp)))

send_measurement(0, stamp.frame)
send_measurement(1, stamp.time)
send_measurement(2, stamp.encoder)
The following code reads an array input and outputs an array.
# Get an array of measurement objects at input 0
measurements = get_measurement(0)

# Extract the values from each measurement object
measurement_values = []
for measurement in measurements:
    measurement_values.append(measurement.value)

# Calculate new values
measurements_output = [value * 2 for value in measurement_values]

# Send the calculated values as an array to output 0
send_measurement(0, measurements_output)
Inverting a Surface in Z with null handling
The following code inverts a Surface in Z with null handling. It also shifts the output Surface in X by the bounding box width in order to not overlap the original.
surf = get_surface(0)

flipped_points = surf.points.copy()
flipped_offset = surf.offset

flipped_points[flipped_points != -32768] *= -1
flipped_offset.x += surf.header.bounding_box.width

send_surface(0, flipped_offset, surf.scale, flipped_points, surf.intensity)
Combining two point cloud surfaces into a single message
s0 = get_surface(0)
s1 = get_surface(1)

if s0.scale.x != s1.scale.x or s0.scale.y != s1.scale.y or s0.scale.z != s1.scale.z or s0.offset.x != s1.offset.x or s0.offset.y != s1.offset.y or s0.offset.z != s1.offset.z:
    log_error("The input surfaces are not using the same resolution and offset. Cannot concatenate.")
    log_info(f"Scale0 = {vars(s0.scale)}")
    log_info(f"Scale1 = {vars(s1.scale)}")

    log_info(f"Offset0 = {vars(s0.offset)}")
    log_info(f"Offset1 ={vars(s1.offset)}")

    return

points_final = numpy.concatenate((s0.points, s1.points))
intensity_final = numpy.concatenate((s0.intensity, s1.intensity))

send_surface(0, s0.offset, s0.scale, points_final, intensity_final, is_adjacent = False)
# Set is_adjacent to True to visualize polygons and intensity
s0 = get_surface(0)
s1 = get_surface(1)
if s0.scale.x != s1.scale.x \
or s0.scale.y != s1.scale.y \
or s0.scale.z != s1.scale.z \
or s0.offset.x != s1.offset.x \
or s0.offset.y != s1.offset.y \
or s0.offset.z != s1.offset.z:
log_error("The input surfaces do not use the same resolution and offset. Cannot concatenate.")
log_info(f"Scale0 = {vars(s0.scale)}")
log_info(f"Scale1 = {vars(s1.scale)}")
log_info(f"Offset0 = {vars(s0.offset)}")
log_info(f"Offset1 ={vars(s1.offset)}")
return
points_final = numpy.concatenate((s0.points, s1.points))
intensity_final = numpy.concatenate((s0.intensity, s1.intensity))
send_surface(0, s0.offset, s0.scale, points_final, intensity_final, is_adjacent = False)
# Set is_adjacent to True to visualize polygons and intensity
Surface Transform based on Plane
surface_obj = get_surface(0)
plane_obj = get_plane(1)
int_surface_points = surface_obj.points
intensity_data = surface_obj.intensity

# Store original shape and reshape for processing
original_shape = int_surface_points.shape
num_points = original_shape[0] * original_shape[1]
points_reshaped = int_surface_points.reshape((num_points, 3))

# Convert 3DPoint objects to numpy arrays for calculations
scale = numpy.array([surface_obj.scale.x, surface_obj.scale.y, surface_obj.scale.z])
offset = numpy.array([surface_obj.offset.x, surface_obj.offset.y, surface_obj.offset.z])
normal_vec = numpy.array([plane_obj.normal.x, plane_obj.normal.y, plane_obj.normal.z])

# Convert integer surface to floating-point "world space"
float_surface_points = points_reshaped.astype(float) * scale + offset

# Normalize the normal vector
norm_of_normal = numpy.linalg.norm(normal_vec)
if norm_of_normal == 0:
    raise ValueError("The normal vector cannot be a zero vector.")
unit_normal = normal_vec / norm_of_normal

# Find the center of the object
center_point = float_surface_points.mean(axis=0)
# Find a point on the plane to establish a reference
point_on_plane = plane_obj.origin_distance * unit_normal

# Determine if the normal points towards or away from the center
vec_to_center = center_point - point_on_plane
if numpy.dot(vec_to_center, unit_normal) > 0:
    # The normal points towards the center of the object. We flip it to get the
    # "outward" normal, ensuring the plane is consistently treated as the "top".
    unit_normal = -unit_normal

# Define the target vector
down_vector = numpy.array([0.0, 0.0, -1.0])

# Calculate the rotation matrix to align the normal with the down_vector
rotation_axis = numpy.cross(unit_normal, down_vector)
cos_angle = numpy.dot(unit_normal, down_vector)

if numpy.allclose(cos_angle, 1.0):
    rotation_matrix = numpy.identity(3)
elif numpy.allclose(cos_angle, -1.0):
    perp_axis = numpy.array([1.0, 0.0, 0.0])
    if numpy.allclose(numpy.abs(numpy.dot(unit_normal, perp_axis)), 1.0):
        perp_axis = numpy.array([0.0, 1.0, 0.0])
    u = perp_axis / numpy.linalg.norm(perp_axis)
    rotation_matrix = 2 * numpy.outer(u, u) - numpy.identity(3)
else:
    # shortcut to the sin between the vectors (based on cross product definition)
    sin_angle = numpy.linalg.norm(rotation_axis)
    rotation_axis /= sin_angle
    K = numpy.array([[0, -rotation_axis[2], rotation_axis[1]],
                  [rotation_axis[2], 0, -rotation_axis[0]],
                  [-rotation_axis[1], rotation_axis[0], 0]])
    rotation_matrix = numpy.identity(3) + sin_angle * K + (1 - cos_angle) * (K @ K)

# Create the full 4x4 homogeneous transformation matrix for rotation only
translation_to_origin = numpy.identity(4)
translation_to_origin[:3, 3] = -center_point
rotation_4x4 = numpy.identity(4)
rotation_4x4[:3, :3] = rotation_matrix
translation_back = numpy.identity(4)
translation_back[:3, 3] = center_point
transformation_matrix = translation_back @ rotation_4x4 @ translation_to_origin

homogeneous_surface = numpy.hstack([float_surface_points, numpy.ones((num_points, 1))])
transformed_homogeneous = (transformation_matrix @ homogeneous_surface.T).T
transformed_float_surface = transformed_homogeneous[:, :3]

# Calculate a new offset to prevent overflow
min_coords = transformed_float_surface.min(axis=0)
Minimum and maximum Z value of a uniform Surface with null handling
surf = get_surface(0)

s = surf.points[surf.points != -32768]

max_z = numpy.max(s) * surf.scale.z + surf.offset.z
min_z = numpy.min(s) * surf.scale.z + surf.offset.z

send_measurement(0, min_z)
send_measurement(1, max_z)
Exporting a surface as a PCD file
import numpy as np


filename = "outsurface.pcd"
msg = get_surface(0)
height_map = msg.points
intensity_map = msg.intensity
scale = msg.scale


rows, cols = height_map.shape


# Prepare the header for the PCD file
header = (
    "# .PCD v0.7 - Point Cloud Data file format\n"
    "VERSION 0.7\n"
    "FIELDS x y z intensity\n"
    "SIZE 4 4 4 4\n"
    "TYPE F F F F\n"
    "COUNT 1 1 1 1\n"
    f"WIDTH {cols}\n"
    f"HEIGHT {rows}\n"
    "VIEWPOINT 0 0 0 1 0 0 0\n"
    f"POINTS {rows * cols}\n"
    "DATA ascii\n"
)


# Write the header and points to the PCD file
with open(filename, 'w') as file:
    file.write(header)
    for i in range(rows):
        for j in range(cols):
            x = i * scale.x
            y = j * scale.y
            z = height_map[i, j] * scale.z if height_map[i, j] != -32768 else 0
            intensity = intensity_map[i, j] if height_map[i, j] != -32768 else 0
            file.write(f"{x} {y} {z} {intensity}\n")


log_info(f"PCD file saved successfully as {filename}")
Grid of coordinates for anchoring
The following script shows how you can perform the same inspection using a single tool at many locations on a grid. It generates X and Y measurement arrays that you use as anchor inputs in another tool (the anchored tool).
In the anchored tool, you must check Enable batching so that the tool generates an array of outputs.
x = numpy.linspace(-15, 15, 10) # 10 points spanning 0..30 mm range
y = numpy.linspace(-15, 15, 10) # 10 points spanning 0..30 mm range

xv, yv = numpy.meshgrid(x, y)

send_measurement(0, xv.flatten())
send_measurement(1, yv.flatten())
Image processing (subtracting two images)
im0 = get_image(0)
im1 = get_image(1)

delta = im0.pixels.astype(numpy.float32) - im1.pixels.astype(numpy.float32)
stdev = numpy.std(delta)

new_pixels = numpy.clip(delta / (2*stdev) * 128 + 128, 0, 255).astype(numpy.uint8)

send_image(0, new_pixels, PixelFormat.RGB_8)
send_measurement(1, stdev)
Image Processing (Subtracting two images and normalizing the result)
im0 = get_image(0)
im1 = get_image(1)

delta = im0.pixels.astype(numpy.float32) - im1.pixels.astype(numpy.float32)
stdev = numpy.std(delta)

new_pixels = numpy.clip(delta / (2*stdev) * 128 + 128, 0, 255).astype(numpy.uint8)

send_image(0, new_pixels, PixelFormat.RGB_8)
send_measurement(1, stdev)
Image processing (forward to HTTP server)
# Script (using built in urlib package)
import urllib.request
import json
import numpy as np

# Assuming get_image(0).pixels returns a numpy array
array = get_image(0).pixels
array_bytes = array.tobytes()

# Encode shape information as JSON in the headers
headers = {'Content-Type': 'application/octet-stream', 'X-Array-Shape': json.dumps(array.shape)}
url = 'http://127.0.0.1:5000/receive_array'

# Encode array bytes data and prepare request
req = urllib.request.Request(url, data=array_bytes, headers=headers)
urllib.request.urlopen(req)


# SERVER (server.py)

from flask import Flask, request, Response
import numpy as np
import cv2
import json

app = Flask(__name__)

@app.route('/receive_array', methods=['POST'])
def receive_array():
    # Get the content of the request
    data = request.data

    # Extract shape information from headers
    shape_info = json.loads(request.headers.get('X-Array-Shape'))
    height, width, channels = shape_info

    # Extract image bytes
    image_array = np.frombuffer(data, dtype=np.uint8)
    image_array = image_array.reshape((height, width, channels))

    # Display image
    #cv2.imshow('Received Image', image_array)
    #cv2.waitKey(0)
    #cv2.destroyAllWindows()

    # Print size of received image
    print("Received image size:", image_array.shape)

    return Response(status=200)

if __name__ == '__main__':
    app.run(debug=False, threaded=True, port=5000)
The following is a sample client to demonstrate the functionality of the HTTP server forwarding snippet above.
# SAMPLE CONSOLE CLIENT (client.py)
# A standalone demonstration of the functionality used by the image HTTP
# forwarding script.

import requests
import numpy as np
import json

# Assuming you have a function to generate numpy arrays as images
def generate_numpy_array():
    # Generating a sample numpy array
    array = np.random.rand(100, 100, 3) * 255  # Random 100x100x3 array of floats between 0 and 255
    return array.astype(np.uint8)

def send_array_to_server(array):
    url = 'http://127.0.0.1:5000/receive_array'
    array_bytes = array.tobytes()

    # Encode shape information as JSON in the headers
    headers = {'Content-Type': 'application/octet-stream', 'Array-Shape': json.dumps(array.shape)}

    response = requests.post(url, data=array_bytes, headers=headers)

# Generate and send arrays to the server
while True:
    array = generate_numpy_array()
    send_array_to_server(array)
Image Processing - Warp an image based on four corners
import cv2
import numpy as np

def warp_image_to_rectangle(image: np.ndarray, src_corners: np.ndarray, output_size: tuple) -> np.ndarray:
    """
    Resample an image to a rectangle based on four corner points.

    :param image: Input image as a NumPy array.
    :param src_corners: Source corner points as a (4, 2) NumPy array (float32).
    :param output_size: Desired output size (width, height).
    :return: Warped and resampled image.
    """
    if src_corners.shape != (4, 2):
        raise ValueError("src_corners must be a (4, 2) array of corner points.")

    width, height = output_size

    # Define destination rectangle corners
    dst_corners = np.array([
        [0, 0],
        [width - 1, 0],
        [width - 1, height - 1],
        [0, height - 1]
    ], dtype=np.float32)

    # Compute perspective transform matrix
    matrix = cv2.getPerspectiveTransform(src_corners.astype(np.float32), dst_corners)

    # Warp the image
    warped = cv2.warpPerspective(image, matrix, (width, height), flags=cv2.INTER_LINEAR)

    return warped

if any_input_invalid():
    send_all_invalid()
    return

image = get_image(0).pixels
c0 = get_point(1).position
c1 = get_point(2).position
c2 = get_point(3).position
c3 = get_point(4).position

src_corners = np.array([
    [c0.x, c0.y],
    [c1.x, c1.y],
    [c2.x, c2.y],
    [c3.x, c3.y]
], dtype=np.float32)

output_size = (800, 400)
result = warp_image_to_rectangle(image, src_corners, output_size)
result = result.reshape((output_size[1], output_size[0], 1))

send_image(0, result, PixelFormat.MONO_8)
Image Processing (Sending out an image with calibrated units)
im = get_image(0)
h = im.header
offset = Point(im.offset.x - 100 , im.offset.y - 100)
scale = Point(im.scale.x / 10, im.scale.y / 10)

send_image(0, im.pixels, pixel_format= PixelFormat.RGB_8,
           offset = offset, scale = scale, unit = UnitType.MILLIMETER)
Profile processing (using a profile from disk as a correction to new profiles from sensor)
# Save profile template to disk
import csv

profile = get_profile(0)
points = profile.points

template_path = r'C:\GoTools\Script\profile.csv'
numpy.savetxt(template_path, points, delimiter=',', fmt='%d')

send_measurement(0, 1)

# Load and correct
import csv

profile = get_profile(0)
points = profile.points

# load template
template_path = r'C:\GoTools\Script\profile_template.csv'

if 'template' not in memory:
    template_points = numpy.genfromtxt(template_path, delimiter=',', dtype=numpy.int16)
    memory['template'] = template_points
    log_info("Loaded template")
else:
    template_points = memory['template']

# subtract while handling null values
mask = (template_points != -32768) & (points != -32768)
result = numpy.full_like(points, -32768)
numpy.subtract(points, template_points, out=result, where=mask, dtype=numpy.int16)

send_profile(0, profile.offset, profile.scale, result)

# optionally send original profile and template as outputs
send_profile(1, profile.offset, profile.scale, points)
send_profile(2, profile.offset, profile.scale, template_points)

# optionally save all three into a new CSV file

output_path = r'C:\GoTools\Script\profile_log.csv'
combined_array = numpy.vstack((points, template_points, result)).T

with open(output_path, 'w', newline='') as csv_file:
    writer = csv.writer(csv_file)
    writer.writerow(['Profile', 'Template', 'Difference'])
    writer.writerows(combined_array)
Instead of looking up functions in the manual to see arguments to be passed in, you can use the signature function in the inspect module to get the signature of any function. For example, the code below displays an error message: (index, value, label_position=None, header=None).
from inspect import signature

log_error(str(signature(send_measurement)))
FTP - Writing surface data to disk, and sending it to an FTP server
This sample was tested with Rebex Tiny FTP server.
import os
import struct
import zlib
from datetime import datetime
from ftplib import FTP
import numpy as np
import time

# FTP Configuration
FTP_HOST = '192.168.1.200'       # CHANGE THIS TO THE FTP HOSTNAME OR IP ADDRESS
FTP_USER = 'tester'              # Default User for Rebex Tiny FTP
FTP_PASS = 'password'            # Default Password for Rebex Tiny FTP

try:
    # Get the surface data
    surface = get_surface(0)

    # Convert surface points to numpy array (height data)
    height_data = np.array(surface.points)

    # Intensity data (already in the 0-255 range, so no normalization needed)
    intensity_data = np.array(surface.intensity)

    # Normalize height data to 0-255, handle NaNs, and convert to uint8
    def normalize(data):
        return np.nan_to_num(((data - np.nanmin(data)) / (np.nanmax(data) - np.nanmin(data) + 1e-8)) * 255).astype(np.uint8)

    # Correct orientation (flip vertically and transpose)
    def correct_orientation(arr):
        return np.flipud(arr.T)

    # Normalize and correct the orientation for height data
    height_img = correct_orientation(normalize(height_data))

    # Intensity data is already in the range 0-255, just ensure it is uint8
    intensity_img = correct_orientation(intensity_data.astype(np.uint8))

    # Write the PNG image to the specified path
    def write_png(path, image):
        try:
            if image.size == 0:
                log_info("Image is empty. Skipping write.")
                return

            # Helper function to create PNG chunks
            def chunk(typ, dat):
                return struct.pack('>I', len(dat)) + typ + dat + struct.pack('>I', zlib.crc32(typ + dat) & 0xffffffff)

            # Open the file and write the PNG data
            with open(path, 'wb') as f:
                f.write(b'\x89PNG\r\n\x1a\n')
                f.write(chunk(b'IHDR', struct.pack(">IIBBBBB", image.shape[1], image.shape[0], 8, 0, 0, 0, 0)))  # Write header chunk
                raw = b''.join([b'\x00' + image[i].tobytes() for i in range(image.shape[0])])  # Write pixel data
                f.write(chunk(b'IDAT', zlib.compress(raw)))  # Write compressed image data
                f.write(chunk(b'IEND', b''))  # End of PNG file
                f.flush()  # Ensure data is written
                os.fsync(f.fileno())  # Sync the file to disk

        except Exception as e:
            log_info(f"Exception in write_png: {e}")

    # Define output directory and file paths for saving images
    output_dir = r'C:\Temp'  # Use a simpler directory for testing
    os.makedirs(output_dir, exist_ok=True)  # Create the output directory if it doesn't exist
    timestamp = datetime.now().strftime('%Y%m%d_%H%M%S')
    path_height = os.path.join(output_dir, f"{timestamp}_height.png")
    path_intensity = os.path.join(output_dir, f"{timestamp}_intensity.png")

    # Write the height and intensity images to files
    try:
        write_png(path_height, height_img)
        log_info(f"Height image written: {path_height}")
    except Exception as e:
        log_info(f"Error writing height image: {e}")

    try:
        write_png(path_intensity, intensity_img)
        log_info(f"Intensity image written: {path_intensity}")
    except Exception as e:
        log_info(f"Error writing intensity image: {e}")

    # Function to wait for file size to stabilize before proceeding with upload
    def wait_for_file_stability(path, check_interval=0.1, max_wait_time=2):
        last_size = -1
        start_time = time.time()

        # Continuously check if the file size has stabilized within the given timeout
        while time.time() - start_time < max_wait_time:
            try:
                current_size = os.path.getsize(path)
                if current_size == last_size:
                    # If file size is stable, exit the loop
                    return True
                last_size = current_size
                time.sleep(check_interval)  # Sleep for a very short interval before checking again
            except FileNotFoundError:
                pass  # Ignore if the file doesn't exist yet
        return False

    # FTP upload function to send files
    def upload(path):
        try:
            with FTP(FTP_HOST) as ftp:
                ftp.login(FTP_USER, FTP_PASS)
                with open(path, 'rb') as f:
                    ftp.storbinary(f'STOR {os.path.basename(path)}', f)  # Upload the file
            return 1
        except Exception as e:
            log_info(f"FTP error: {e}")
            return 0

    # Upload both height and intensity images via FTP
    send_measurement(0, upload(path_height))
    send_measurement(1, upload(path_intensity))

except Exception as e:
    log_info(f"Error in processing surface data: {e}")
    send_measurement(0, 0)  # Indicate failure if an exception occurs during processing
import numpy as np


class MovingAverage:
    def __init__(self, window_size=10):
        self.window_size = window_size

    def add_value(self, value):

        # Add value if the 'Values' key is present else initialize with an empty list.
        memory.setdefault("Values", []).append(value)
        if len(memory["Values"]) > self.window_size:
            memory["Values"].pop(0)
        return self.calculate_average()

    def calculate_average(self):
        if not memory["Values"]:
            return np.nan
        return np.mean(memory["Values"])


# Get values
measurement = get_measurement(0)
measurement_value = measurement.value

# Process values
moving_avg = MovingAverage(window_size=10)
avg = moving_avg.add_value(measurement_value)

# Send values
send_measurement(0, measurement_value)
send_measurement(1, avg)
Communicate with Another Sensor via ASCII Using Socket Programming
import socket

HOST = "192.168.1.10"
PORT = 8190

DELIMITER = ','
TERMINATION = '\r\n'  # Matches %r%n set by default in GoPxL > Ethernet ASCII page

START_COMMAND = f'start{TERMINATION}'
STOP_COMMAND = f'stop{TERMINATION}'
TRIGGER_COMMAND = f'trigger{TERMINATION}'
SYSTEM_STATE_COMMAND = f"readprop{DELIMITER}/system#/runState{TERMINATION}"

try:
    s = socket.socket(socket.AF_INET, socket.SOCK_STREAM)
    s.settimeout(15)
    s.connect((HOST, PORT))
    log_info(f"Connected to sensor at {HOST}:{PORT}")

    _ = s.send(SYSTEM_STATE_COMMAND.encode()) # Requires data to be sent in byte format
    response = s.recv(1024).decode().strip().split(',') # Receives up to 1024 bytes of data from the socket connection
    log_info(f"Response received: {response}")

    if len(response) > 1 and response[0] == "OK":
        run_state = response[1]
        if run_state == "0": # If sensor is not running, first run then trigger
            _ = s.send(START_COMMAND.encode())
            _ = s.send(TRIGGER_COMMAND.encode())
        elif run_state == "1":
            _ = s.send(TRIGGER_COMMAND.encode())
        else:
            log_info(f"Unexpected system state: {run_state}")

except socket.timeout:
    log_error(f"Error: Operation timed out. ASCII is disabled or sensor is unreachable at {HOST}:{PORT}.")
except Exception as e:
    log_error(f"An error occurred: {e}")
finally:
    s.close()
    log_info("Socket closed.")
Save screenshot with the displayed outputs in the data viewer
Before using this sample, you must install two python modules: selenium and webdriver_manager. Note that this script is intended for use on GoPxL for PC.
| 1. | Using Command Prompt or PowerShell, go to the GoPxl_UserTools\bin\win64\python folder. |
| 2. | (Optional) To show the installed Python modules, run python3.exe -m pip list. |
| 3. | To install selenium, run python3.exe -m pip install selenium. |
| 4. | To install webdriver_manager, run python3.exe -m pip install webdriver_manager. |
To save a screenshot in a script, after adding a Script tool and copying and pasting the sample code into the Code field, do the following:
| 1. | If it's not already open, expand the Displayed outputs pane. |
| 2. | Configure which outputs you want displayed in the data viewer by pinning or hiding outputs. |
For more information on the Displayed outputs pane, see Displaying and Pinning Outputs.
| 3. | Click the link icon at the lower right. |
This copies the current state of the data viewer, including the currently .
![]()
| 4. | Paste the link into the code as the value of url. |
The script saves a .png file to the location in the script.
from selenium import webdriver
from selenium.webdriver.chrome.service import Service
from selenium.webdriver.chrome.options import Options
from webdriver_manager.chrome import ChromeDriverManager
from datetime import datetime
import os

if not hasattr(self, 'long_mem'):
    self.long_mem = {}

if "service" not in self.long_mem:
    self.long_mem["service"] = Service(ChromeDriverManager().install())
service = self.long_mem["service"]

# Set the URL here
url = "www.google.com"
log_info(f"{type(url)}")

if "driver" not in self.long_mem:
    chrome_options = Options()
    chrome_options.add_argument("--headless=new")  # Use "--headless=new" for newer versions of Chrome
    chrome_options.add_argument("--window-size=1920,1080")  # Important for full screenshots
    #chrome_options.add_argument("--disable-gpu")  # Optional: helpful on Windows

    self.long_mem["driver"] = webdriver.Chrome(service=service, options=chrome_options)
    self.long_mem["last_url"] = url  # Initialize last_url to None

# Check if the URL has changed
if self.long_mem["last_url"] != url:
    log_info(f"changing url to {url}")
    self.long_mem["driver"].get(url)
    self.long_mem["last_url"] = url  # Update last_url to the current URL

driver = self.long_mem["driver"]

# Create a timestamped filename
timestamp = datetime.now().strftime('%Y-%m-%d_%H-%M-%S')
filename = f"screenshot_{timestamp}.png"

# Optional: specify a directory to save screenshots
output_dir = os.path.expanduser("~/Pictures/Screenshots")
os.makedirs(output_dir, exist_ok=True)

filepath = os.path.join(output_dir, filename)
driver.save_screenshot(filepath)

log_info(f"{filepath} saved")

send_measurement(0,0)
Buffering a sequence of surfaces and outputting them as an array
# specify the captured count when we send out the array
# it should be the same as the value of the parameter `Surface Count` in the Surface Stitch tool
capturedCount = 3

surf = get_surface(0)

if 'captured' not in memory: # memory is type of dict
    memory['captured'] = [] # a list with fixed items

# if 'captured' not in memory or len(memory['captured']) != capturedCount: # memory is type of dict
#     memory['captured'] = [None] * capturedCount # a list with fixed items

captured = memory['captured']

surf = get_surface(0)
captured.append(surf)

if len(captured) == capturedCount: # if the passed Captured value is equal to the item count of the list
    offsets = []
    scales = []
    points = []
    intensities = []
    headers = []

    for s in captured:

        str = type(s)
        log_info(str)

        offsets.append(s.offset)
        scales.append(s.scale)
        points.append(s.points)
        intensities.append(s.intensity)

    send_surface(0, offsets, scales, points, intensity=intensities, header = surf.header)
    log_info('sending out a surface point cloud array')
    memory['captured'].clear()
Down-sampling Surface Point Cloud Array
import numpy as np

# Downsample factor
FACTOR = 4

# Get the list of surfaces
surfaces = get_surface(0)

if surfaces is not None:
    # Initialize lists to hold the output batch data
    out_points = []
    out_intensities = []
    out_scales = []
    out_offsets = []
    out_adjacents = []

    for surf in surfaces:
        # Downsample Points/Intensity
        # Use slicing [start::step] to keep every Nth pixel
        out_points.append(surf.points[::FACTOR, ::FACTOR])
        out_intensities.append(surf.intensity[::FACTOR, ::FACTOR])

        # Pass through scale, offset & is_adjacency
        out_scales.append(surf.scale)
        out_offsets.append(surf.offset)
        out_adjacents.append(surf.is_adjacent)

    # Send the surface point cloud array
    send_surface(
        0,
        offset=out_offsets,
        scale=out_scales,
        points=out_points,
        intensity=out_intensities,
        is_adjacent=out_adjacents
    )
This script demonstrates the use of points, lines, regions, and labels.
# Calculates the average of two points and outputs coordinates
# as individual measurements and a combined Point feature.
# Inputs should be configured as:
#   Input 0 - Surface
#   Input 1 - Point 1 X
#   Input 2 - Point 1 Y
#   Input 3 - Point 2 X
#   Input 4 - Point 2 Y
# Outputs should be configured as:
#   Output 0 - Measurement (Midpoint X)
#   Output 1 - Measurement (Midpoint Y)
#   Output 2 - Point (Midpoint)

if any_input_invalid():
    send_all_invalid()
    return

# 1. Configuration: Visual Styles
POINT_SIZE   = 15
MID_SIZE     = 10

# 2. Data Extraction
x1, y1 = get_measurement(1).value, get_measurement(2).value
x2, y2 = get_measurement(3).value, get_measurement(4).value


# 3. Math: Calculate the Midpoint
mx = (x1 + x2) / 2.0
my = (y1 + y2) / 2.0
midpoint = (mx, my)

# 4. Visualization
# Draw a connection line between the two source points
draw_lines([(x1, y1), (x2, y2)], color=Colors.GRAY, width=1)

# Draw a region that perfectly bounds the two points
# Using abs() ensures valid positive dimensions for the region width and height
draw_region(midpoint, (abs(x2 - x1), abs(y2 - y1), 1), 0.0)

# Draw source points as white circles
# For the first point, make the color dependent on the decision Pass/Fail of the input measurement
pointColor1 = Colors.RED
if get_measurement(1).decision == MeasurementDecision.PASS:
    pointColor1 = Colors.GREEN
draw_points((x1, y1), color=pointColor1, size=POINT_SIZE, shape=MarkerShape.CIRCLE)
draw_points((x2, y2), color=Colors.WHITE, size=POINT_SIZE, shape=MarkerShape.CIRCLE)

# Draw crosshair lines centered on the midpoint
# lineX spans the Y-distance; lineY spans the X-distance
# The lines are associated the X and Y tool outputs, so
# they are only drawn when that output is selected
lineX = [(mx, y1), (mx, y2)]
lineY = [(x1, my), (x2, my)]

draw_lines(lineX, color=Colors.CYAN, width=2, output=0)
draw_lines(lineY, color=Colors.CYAN, width=2, output=1)

# Label the midpoint with its coordinates
draw_label(f"Mid: {mx:.2f}, {my:.2f}", (mx, my))

# 5. Output Results
send_measurement(0, mx)
send_measurement(1, my)
send_point(2, midpoint)
Drawing green / red border around a Surface for Pass/Fail of a measurement
# --- GoPxL Surface Bounding Box Example ---
# Draws a red/green outline around the surface data extents
# based on the pass/fail decision of a specific measurement.
# Also outputs a string PASS/FAIL that can be pinned to keep
# the graphics visible.

if any_input_invalid():
    send_all_invalid()
    return

# 1. Configuration & Data Extraction
# For surface data:
surface = get_surface(0)
# For image data:
# image = get_image(0)
decision_meas = get_measurement(1)

# Offset and scale are also available on images
ox = surface.offset.x
oy = surface.offset.y

sx = surface.scale.x
sy = surface.scale.y

# Get dimensions from the points array shape (height, width)
height = surface.points.shape[0]
width = surface.points.shape[1]
# For images:
# image.pixels.shape[0]
# image.pixels.shape[1]

# 2. Math: Calculate Bounding Box Extents
min_x, min_y = ox, oy
max_x = ox + (width * sx)
max_y = oy + (height * sy)

# 3. Decision Logic
status_color = Colors.GREEN if decision_meas.decision == MeasurementDecision.PASS else Colors.RED

# 4. Visualization
# Define the four corners of the surface area
outline_points = [
    (min_x, min_y), (max_x, min_y), # Top Edge
    (max_x, min_y), (max_x, max_y), # Right Edge
    (max_x, max_y), (min_x, max_y), # Bottom Edge
    (min_x, max_y), (min_x, min_y)  # Left Edge
]

# Draw the border and associate it with output 0 so it can be pinned
draw_lines(outline_points, color=status_color, width=5, output=0)

# 5. Output a string PASS/FAIL
send_string(0, "PASS" if  decision_meas.decision == MeasurementDecision.PASS else "FAIL")