Surface Anomaly Detector

|
This tool requires a special dongle to function with live sensor data. (Available for purchase from LMI.) |
The GoPxL Anomaly Detector toolset lets you train and deploy AI-powered anomaly detection in parts and surfaces in scan data produced by a compatible Gocator sensor. The toolset includes the following:
-
The Surface Anomaly Detector tool: This tool provides an AI-based model training routine and an inference engine that uses a trained model to predict whether something in production scan data is an anomaly. The training routine steps you through the process of training on "good" (OK) and "bad" (NG) example frames. The tool can also simulate part orientation and acquisition variations, as well as synthetic NG frames to improve model performance.
-
The Training Archive tool: An auxiliary tool that conditionally saves frames to a project created in Surface Anomaly Detector, letting you improve the model on scan data acquired at a later time. For information on the Training Archive tool, see Training Archive.
The toolset supports both 2D intensity and 3D data. Surface Anomaly Detector runs on and requires the use of a GoMax NX accelerator, as well as a hardware dongle for use with live scan data during production.
Sample datasets are available in a package on LMI's Download page. For more information, see Sample Data.
|
|
The Anomaly Detector tool can be used with all Gocator sensors, except G1 sensors, G200 sensors, and G2300 revision A or B G2 models. |
Hardware Requirements
The following hardware is required to deploy the GoPxL Anomaly Detector in production:
-
One or more compatible Gocator 3D sensors: G2, G3, G4 or G5. Note that GoPxL can only accelerate a single G3 sensor.
-
A GoMax NX accelerator.
-
A GoPxL Anomaly Detector license and dongle, inserted into a USB port on the GoMax unit.

A license and dongle are required for running the tool on live scan data. Without the dongle, you can only evaluate the tool on previously scanned data. The tool will also display an error message without a dongle:
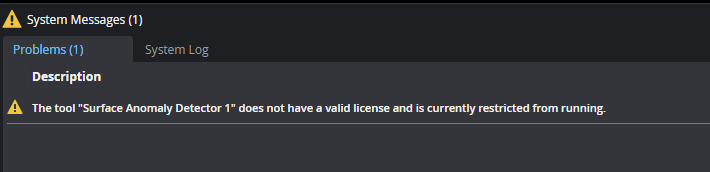
Plugging in the license dongle will license the tool. If the sensor system is running when you insert the dongle (that is, acquiring scan data), you must stop the system before it will license the tool.
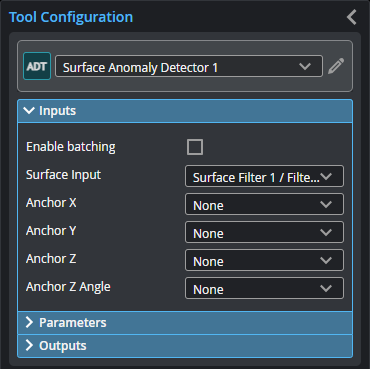
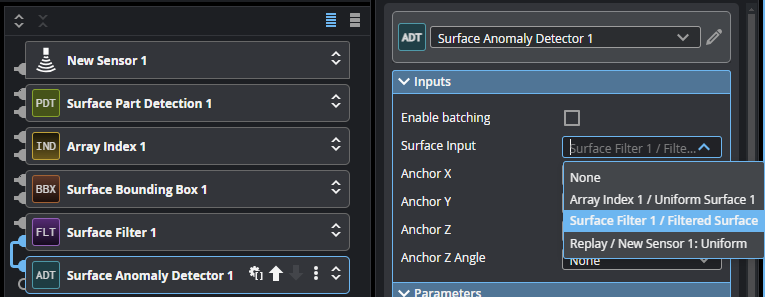
Inputs
You configure the tool's inputs in the expandable Inputs section.
|
|
To use a measurement as an anchor, it must be enabled and properly configured in the tool providing the anchor. For more information on anchoring, see Measurement Anchoring. |
| Name | Description |
|---|---|
| Enable Batching |
For more information on arrays, batching, and aggregating, see Arrays, Batching, and Aggregation. |
|
Surface Input |
The data the tool applies measurements to or processes. This tool can optionally take an array as input. For more information, see Arrays, Batching, and Aggregation. |
|
Anchor X Anchor Y Anchor Z |
The X, Y, or Z measurement of another tool that this tool uses as a positional anchor. Positional anchors are optional. |
| Anchor Z Angle |
The Z Angle measurement of another tool to use as a rotational anchor for this tool. Rotational anchors are optional. |
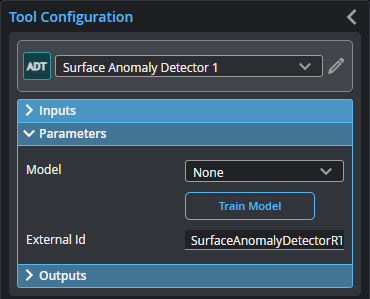
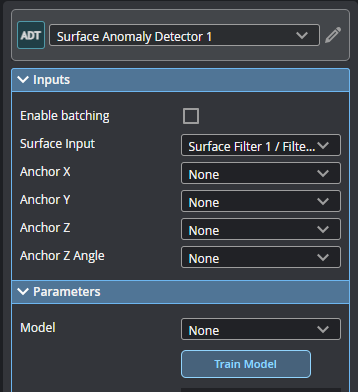
Parameters
You configure the tool's parameters in the expandable Parameters section.
| Parameter | Description |
|---|---|
|
Model |
Chooses the trained model the tool uses to detect anomalies during production. |
|
Train Model |
Starts the model training routine, which steps you through process. For more information, see Train Model. |
|
External ID |
The external ID of the tool that appears in GoHMI Designer. For more information, see GoHMI and GoHMI Designer. |
Development Workflow
The high level workflow is as follows:
| 1. | Collect representative scans of the part you need to inspect in order to train an Anomaly Detector model. In addition to "good" parts, you need to scan "bad" parts, that is, ones with typical defects. |
| 2. | Create a pre-processing toolchain and train an Anomaly Detector model on GoMax. |
| 3. | Deploy the Anomaly Detector model and connect post-processing tools. |
| 4. | Optionally, collect new production data for model retraining on a GoMax. |
Collect dataset
Unless you are using a previously created dataset, you must create the dataset that the GoPxL Anomaly Detector will use for training a model before it can detect anomalies in new production data. To do this, perform the following steps:
| 1. | Record representative scans of 20 or more OK targets (targets with no flaws) and 20 or more NG targets (targets with flaws). |
You can record the scans to a single .gprec file or to multiple files. If you record scans to a single file, grouping each type (OK and NG) together will make it easier to label them later in the wizard. Make sure there are no empty frames: each frame should contain either an OK or an NG target. Do not rely on .gpsup or .rec for this as the Anomaly Detector wizard requires .gprec files when importing from PC.
| 2. | Save a separate .gpsup file with the sensor configuration settings such as exposure time and related imaging parameters. |
Ensure the same parameters are used on the production system. Otherwise, you will need to collect new training data.
Implement a Preprocessing Toolchain
The preprocessing tool chain limits variation in the scan data to the region or surface of interest (with and without anomalies). With less variation in the scan data, the total number of frames needed for training is reduced.
The preprocessing tool chain must not change between training and inference. Otherwise, the system will not function properly. You must save your preprocessing toolchain in the .gpsup file created previously or using a separate .gpjob file.
|
|
You must use the same preprocessing toolchain for training and inference to ensure proper detection of anomalies. |
Train Model
Add Surface Anomaly Detector Tool
| 1. | Add and connect a Surface Anomaly Detector tool to the output of the preprocessing tool chain. |
| 2. | In tool's Parameters section, click the Train Model button. |
The routine starts and the Select Project page opens. You will create a new project in this page, or open a previously created project.
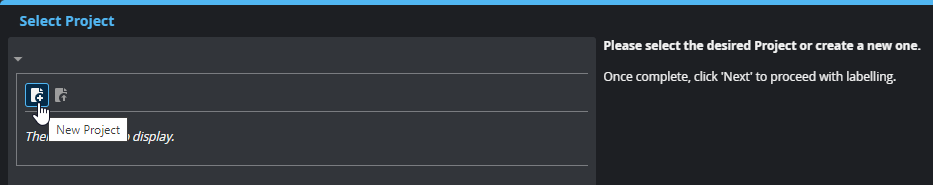
Create New or Open Project
A project is a collection of frames used for training, the models trained on those frames, and user labels (OK and NG). You should choose a meaningful project name, such as the part name, especially when working with multiple projects.
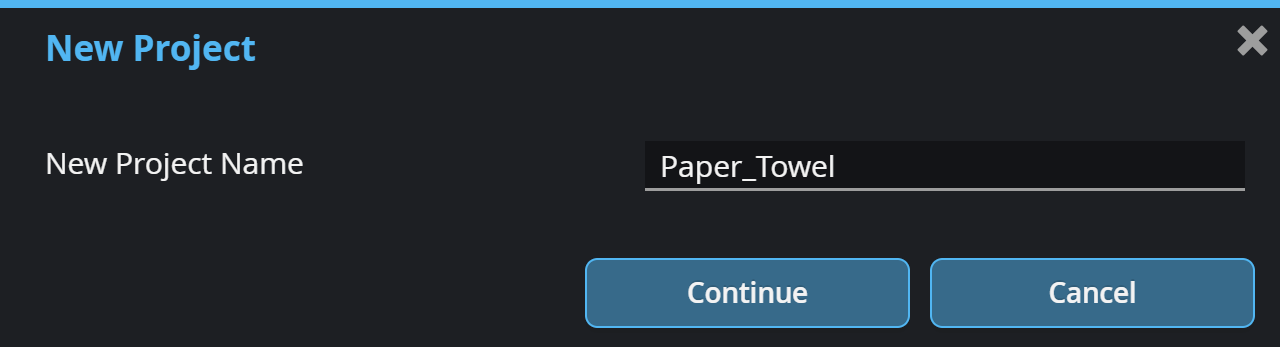
| 1. | On the Select Project page, click the New Project icon, provide a project name, click Continue, and then click Next. |
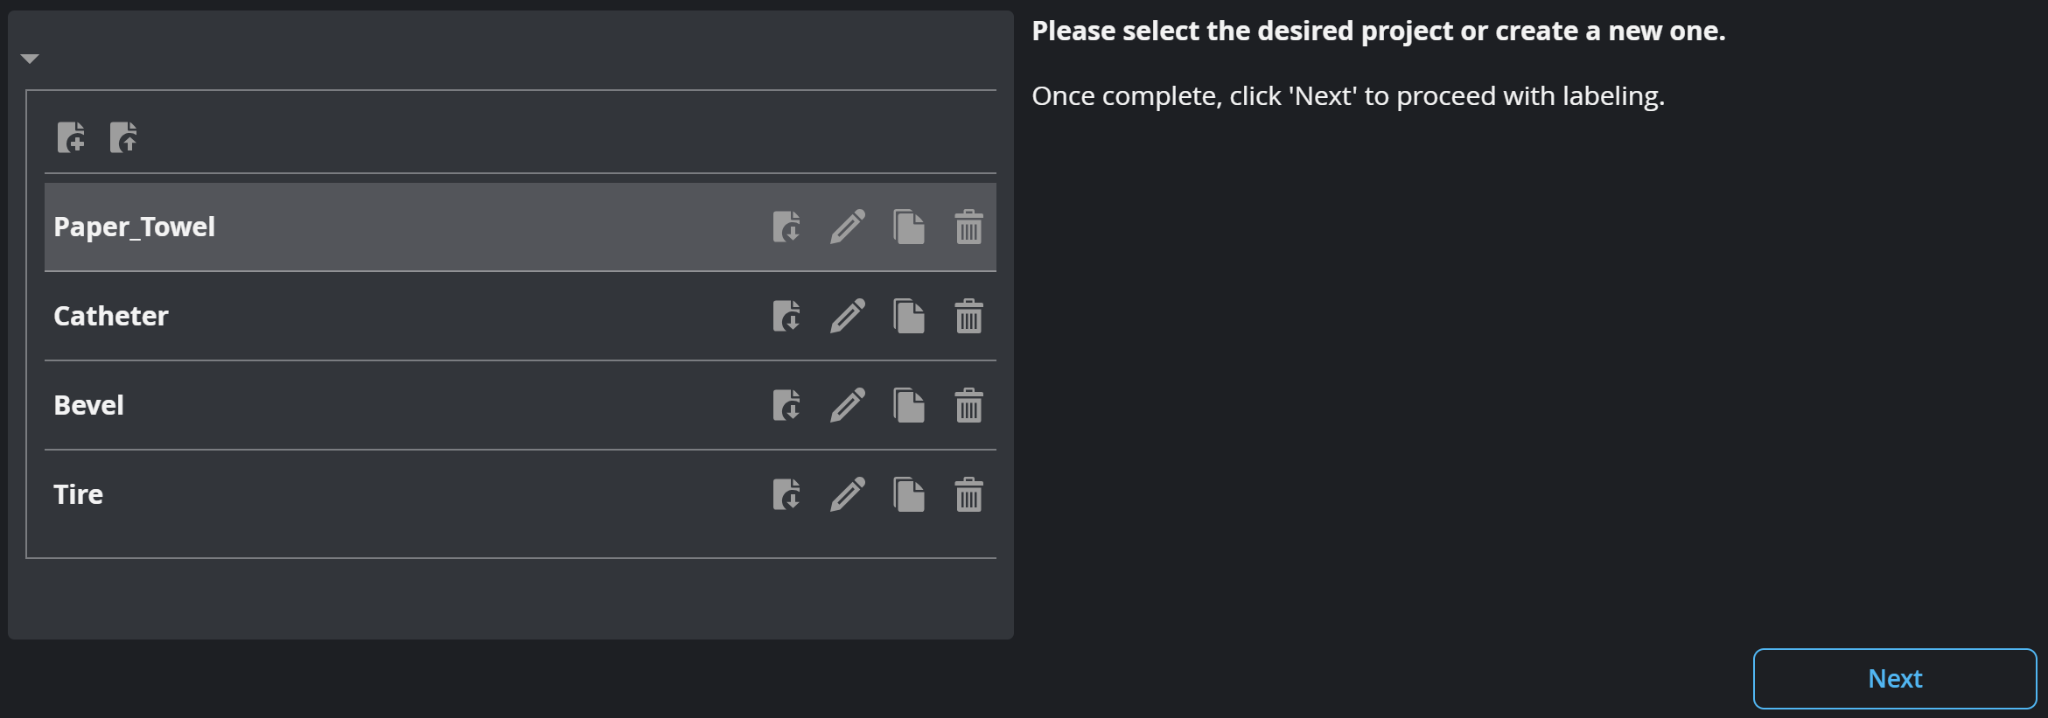
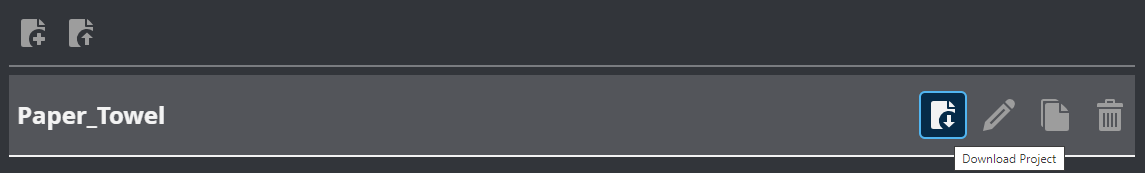
Use the download icon on each project row to download this to your PC and upload to another GoMax.
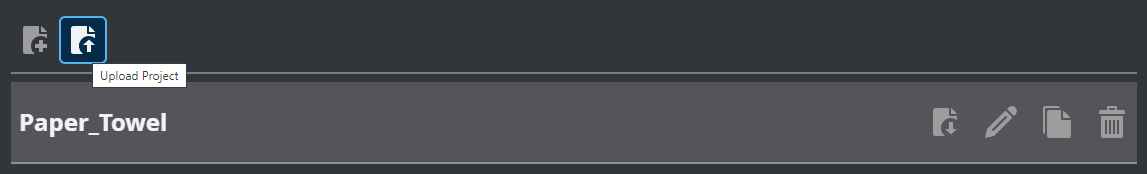
Use the upload icon to import a previously downloaded project.
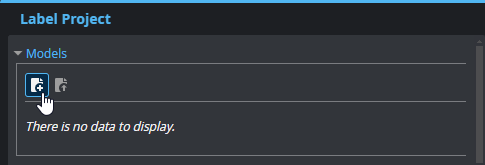
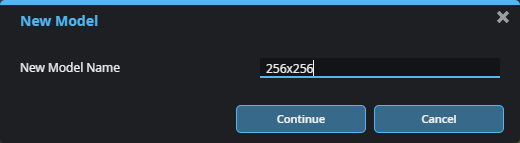
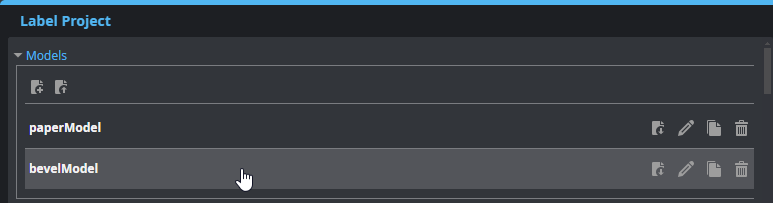
| 2. | In the Label Project page, in the Models section, create a new model and click Continue. |
| 3. | (Optional) To download a project to the connected PC in order to upload it to another GoMax accelerator, click the Download icon on a project's row . |
| 4. | (Optional) Click the Upload icon to import a previously downloaded project. |
| 5. | In the Frames section, do one of the following |
- To upload the data currently in the replay buffer, click the Upload Replay Data button (
 ) , and then click Continue.
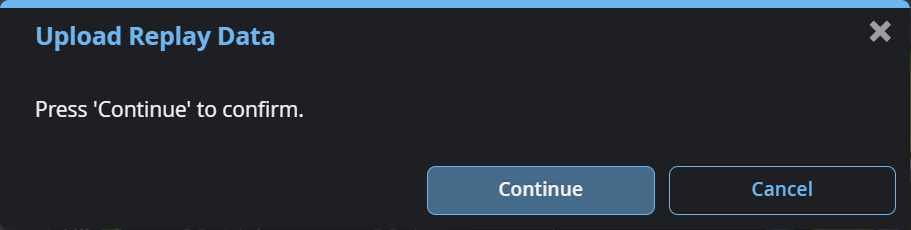
- To upload the data from a .gprec file on the local PC, click the Upload From Disk button (
 ) .
) .
The tool loads the frames into the model.

|
Loading replay data into the project can take several minutes. If a “Delayed Response” message displays, click “Wait.” In this case, add a Decimation Filter to the pipeline. |
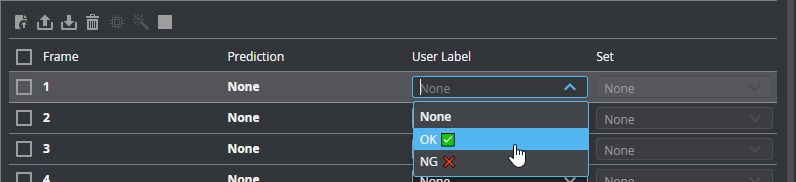
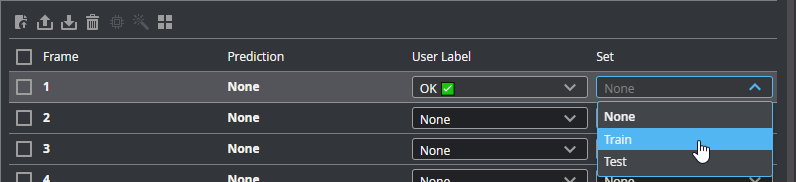
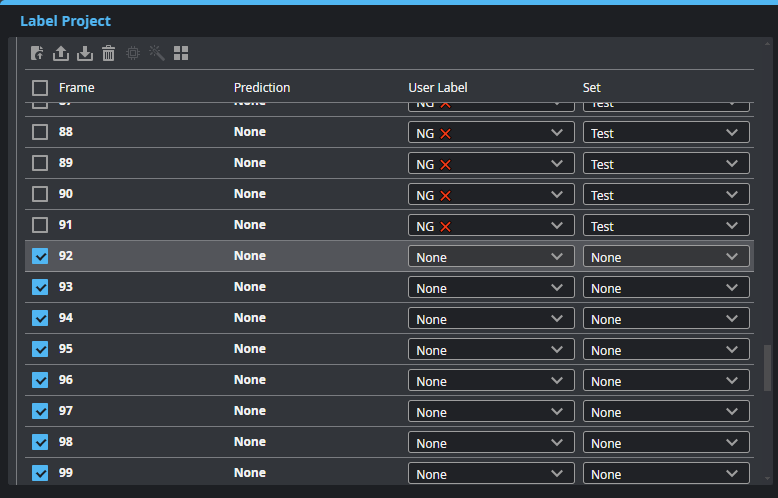
Label Frames and Choose Set
You must now label each frame as “OK” or “NG” (under the User Label column). You must also choose the set each frame belongs to (Train or Test, under the Set column).
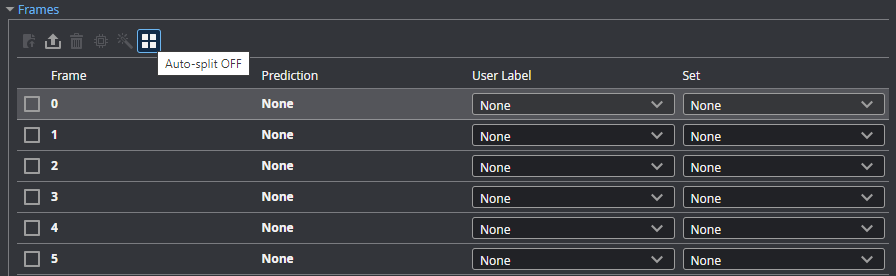
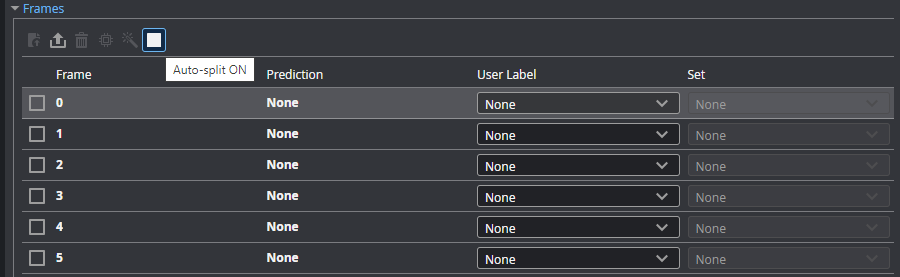
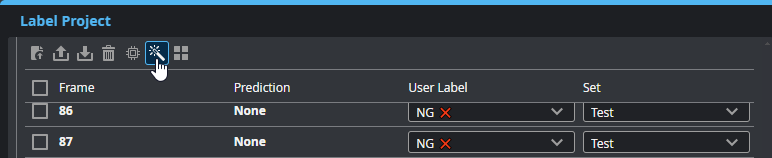
| 1. | (Optional) To have the system automatically allocate frames to the Train or Test set, click the Auto-split icon. |
The Set column will become read only. When you set a frame's user label, the tool assigns it to the sets in the proportions described below.
Auto-split uses the following proportions to allocate each frame into a set:
80% of OK is in Train
20% of OK is in Test
100% of NG is in Test
You can also enable auto-split after setting the user labels.
| 2. | In the row of each frame, under User Label, choose the correct label. |
If you have not enabled auto-split, also choose the frame's set under Set. Make sure you use the proportions described in step 1.
To quickly choose the label and set for multiple frames, do one of the following to first select the frames:
- To select a range of frames, click the checkbox of the first frame, press Shift, and click the checkbox of the last frame of the range.
- To select multiple frames, click the checkbox of the first frame, press Ctrl, and click the checkbox for each frame you want to select.
- To select non-contiguous ranges, alternate between clicking Ctrl and Shift.
After selecting the frames, choose the label and the set as described above. To deselect all frames, click anywhere between the checkbox and the User Label and Set drop-down menus.
| 3. | Click Next to configure training. |
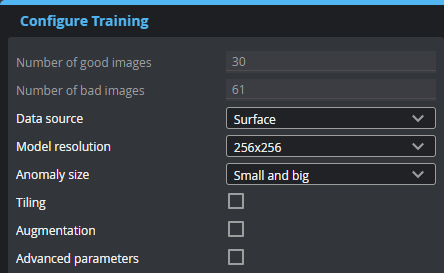
Configure Training
After labeling the frames and choosing the set they belong to, you must configure training. For descriptions of the settings, see below.
| Parameter | Description |
|---|---|
|
Number of good images Number of bad images |
Read-only fields that display the number of frames labeled OK and NG, respectively. |
|
Data source |
The source the tool uses during training: Surface or, if available, Intensity data. |
| Model resolution | Decimates the input data to the specified resolution for processing. Note that using a higher resolution increases the memory requirements for training. |
| Anomaly size |
One of the following: Small and big, Big, Small. If your targets only have small or big defects, choosing the corresponding size can help reduce false positives. |
| Tiling |
Enables tiling. Tiling divides the frames of training data into sections. The tool uses the same model for each tile, which increases the resolution of the model. This lets the tool potentially find smaller defects or increase detection accuracy. You should only use tiling with homogenous targets (for example, paper towel, wood decking, and so on) or symmetric targets. For discrete parts with a complex or asymmetric shape, disable this setting. After enabling tiling, set the number of vertical and horizontal tiles. Choose a tiling configuration that matches the aspect ratio of the input data. Note that using tiling increases the memory requirements for training considerably. For example, with 5x5 tiling, the tool uses 25 times more memory. |
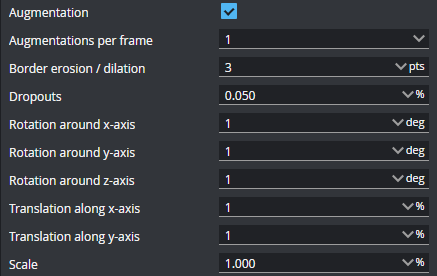
| Augmentation |
When Augmentation is enabled, the tool simulates random part orientation, size, and acquisition variations to improve training, using the provided settings. The rotation, translation, and scale values are used to create a range. So for example, a Z axis rotation value of 1 degree results in a range between -1 and 1, from which the tool chooses a random value to improve the training. The Dropouts value represents the upper limit of the range between 0 and the provided percentage. Choose augmentations that are representative of the variations you encounter during production. Augmentations that aren't representative may lead to poor results. You can visualize augmentations on the Model Performance page, which is available after training is complete; for more information, see Test Model Performance.
Augmentations per frame The number of augmentations generated for each frame. Augmentations are not added to the total number of frames in the project itself.
Border erosion / dilation Performs erosion and dilation operations on each frame, using the provided value as the size of the kernel.
Dropouts Removes data points randomly to simulate low exposure, up to the specified percentage of the original scan data.
Rotation settings The Rotation settings limit rotation of simulated data around the X, Y, and Z axis.
Translation settings The Translation settings limit movement of simulated data on the XY plane, as a percentage of the data points in the frame.
Scale Limits the scaling of simulated data. |
| Synthesize bad frames |
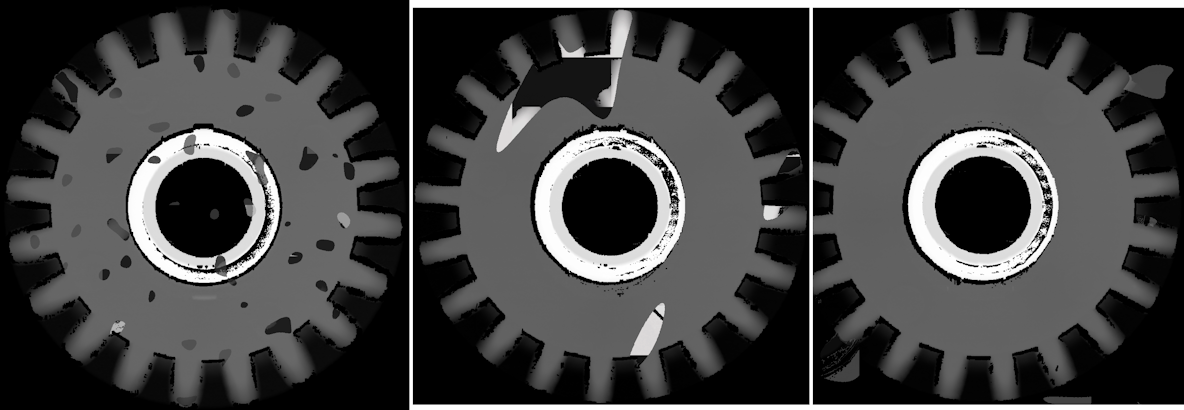
When this setting is enabled, the tool synthesizes bad (NG) frames from the good (OK) frames in the project. The frames are used internally during training but are not added to the frames in the project or shown in the tool. The following are examples of synthesized frames:
Enable this setting if your project contains very few NG frames. The setting is automatically enabled if the project contains no NG frames. |
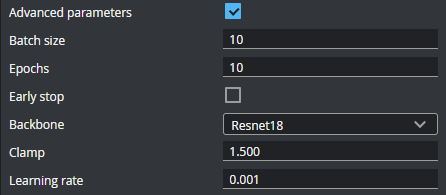
| Advanced parameters |
You do not normally need to modify these parameters. Use caution when modifying them.
Batch size The number of frames in a batch (a subset of the entire dataset passed to the training algorithm for an iteration). Decrease this value if you are using a model with a 512x512 resolution or tiling. A higher value uses more memory.
Epochs This is the number of times the entire dataset passes through the training algorithm. Increase this value if the Loss function is not converging.
Early stop If enabled, the tool will stop training before the total number of epochs is completed if the model’s performance stops improving.
Backbone The feature extractor used by the tool.
Clamp The range within which the data values should be clamped. Lower this value if the AUROC and loss functions are not converging.
Learning rate The speed at which the model learns. A higher value causes the model to learn more quickly, with "bigger steps." But a value that is too high can cause the model to miss the point in the Loss function where the difference between predicted and actual OK / NG is at its smallest (that is, overshooting it). A lower value causes the model to learn more slowly, but potentially more accurately; if the value is too low, the model can get stuck. |
After you configure training, click Start Training to train the model. The tool will start by preparing the training data, providing progress feedback:
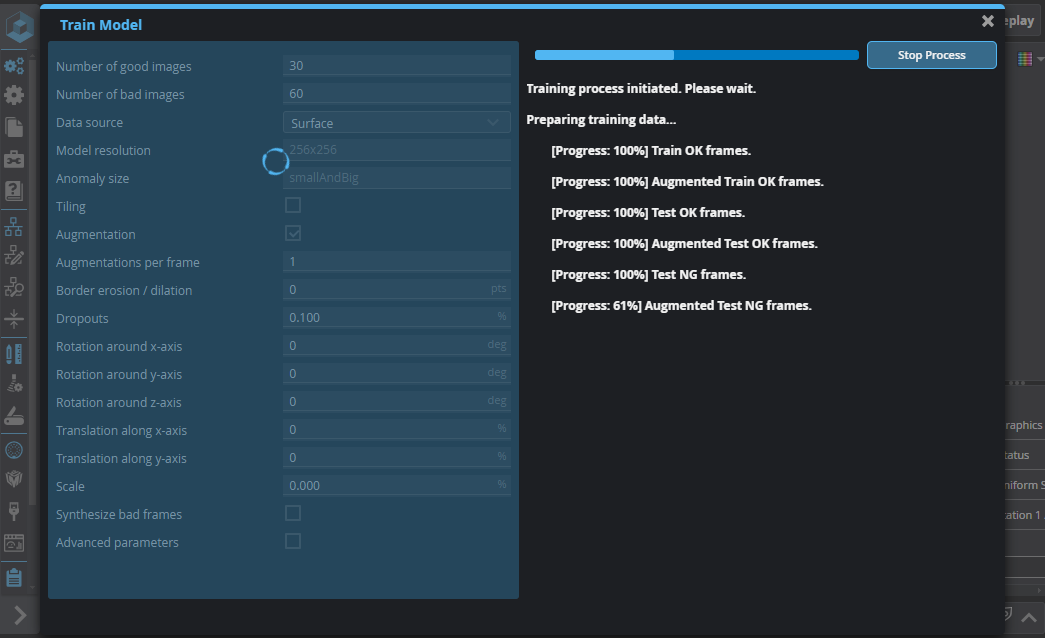
After the data is prepared, the tool will start generating Loss and AUROC graphs.
Loss: This graph represents the cumulative error for each frame in the Test set, determined after each training run iteration or epoch. A decreasing number (the graph's line is moving down) implies the model is improving.
AUROC: This graph defines how well the model can distinguish between the OK and NG user labels. A value of 1 (the graph's line is moving up) represents the best possible result.
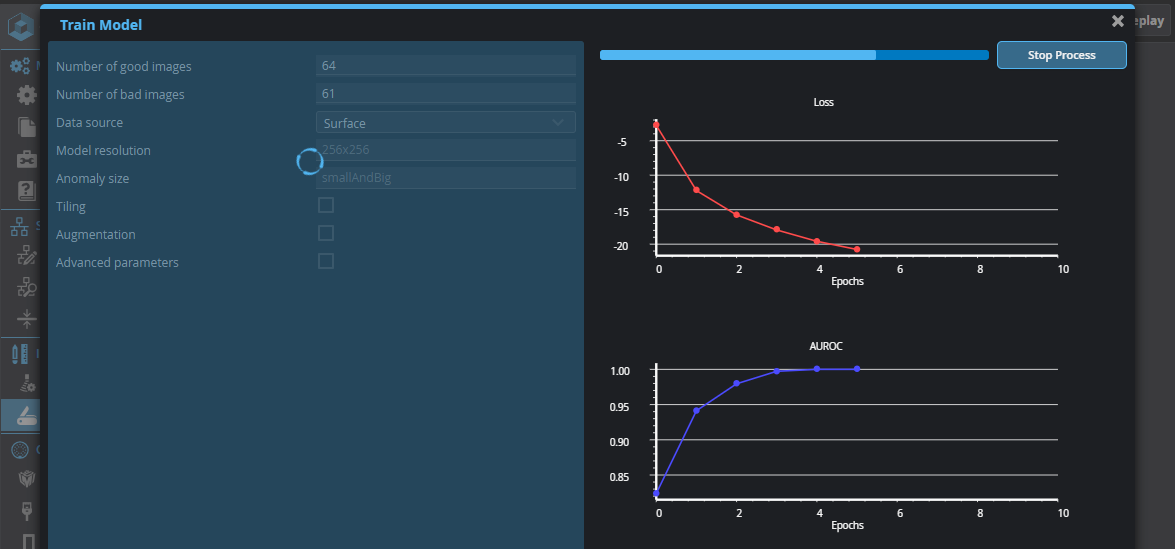
As the tool trains the model on the labeled frames, the graphs should converge, that is, Loss will decrease, and AUROC will increase, approaching 1 (the best possible result). After the training has completed, click Next to test the model. Note that training can take several minutes.
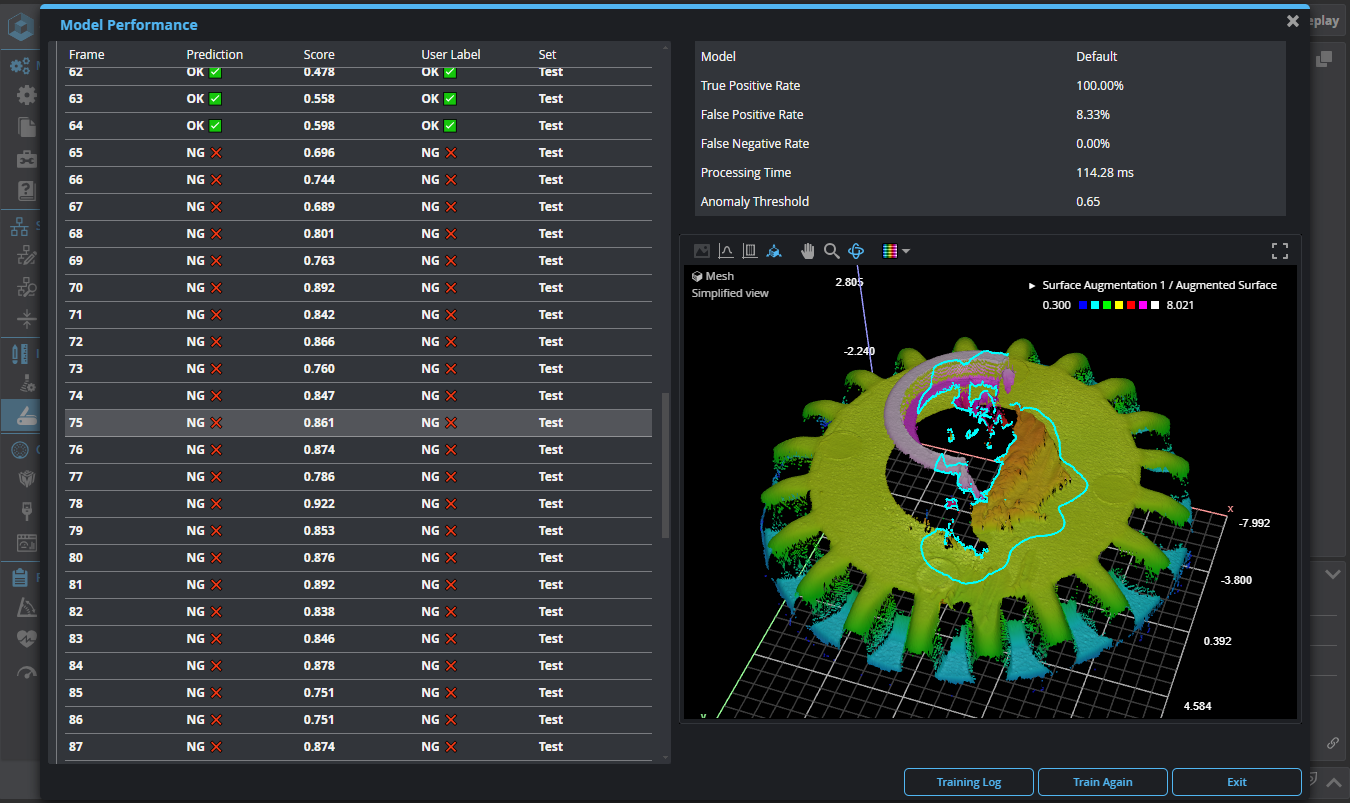
Test Model Performance
After the tool has finished training the model, it will use the model to make predictions on the frames to determine the anomaly score for each frame, as well as the anomaly threshold. The Model Performance page displays the following results:
| Name | Description |
|---|---|
|
Model |
The trained model the tool used to detect anomalies during the model performance phase. |
|
True Positive Rate |
The percentage of frames correctly predicted as OK. |
| False Positive Rate | The percentage of frames incorrectly predicted as OK. |
| False Negative Rate | The percentage of frames incorrectly predicted as NG. |
| Processing Time | The average time required for inference. Includes the pre-processing tool chain. |
| Anomaly Threshold |
The threshold to which a frame's Anomaly Score is compared to determine whether the frame is an anomaly. An anomaly score above this value is an anomaly. |
You can use the Anomaly visualization drop-down to view different outputs of the Surface Anomaly Detector tool:
| Name | Description |
|---|---|
|
Anomaly Outline |
Displays the Surface data of the frame with anomalies outlined, if present. |
|
Heatmap |
A diagnostic Image output overlaying the Anomaly Map output on the input data. This output can make it easier to see whether the brighter areas in the anomaly map correspond with flaws in the target. |
| Anomaly Map | A diagnostic Image output that contains grayscale values representing a per-pixel score of how anomalous that pixel is. Brighter areas should correspond to flaws. When Anomaly Map is passed to segmentation tools such as Surface Blob, the data can be used to locate and measure the size of the anomalies. |
If you have enabled augmentations in the training configuration, you can use the Show augmentations drop-down to switch between a frame's original scan data and a simulated frame to get an idea of the effect of the augmentation settings. Note that the augmentations the tool shows are not the ones used in training: they are random simulations. Also, the score displayed in the selected row is the original frame's score, not the augmented frame. The following options are available:
| Name | Description |
|---|---|
|
Original |
The frame's original scan data. |
|
Upper Limit Lower Limit |
These options display a frame with maximum and minimum augmentation values applied to the scan data, respectively. Note that the maximum / minimum values are determined by the settings in the Configure Training step of the routine (see Configure Training). For example, if you have set the Z axis rotation to 1 degree, Upper Limit will show the frame rotated 1 degree clockwise. Lower Limit will show the frame rotated 1 degree counter clockwise. For Border erosion / dilation, Upper Limit and Lower Limit show the effect of dilation and erosion operations, respectively, using the provided kernel size. If you have enabled dropouts (by setting the Dropouts slider in the training configuration to a non-zero value), with Upper Limit, the tool removes a random selection of data points using the percentage provided . With Lower Limit (which is equivalent to 0% in the setting), no data points are removed. |
| Random |
The tool applies random values chosen from the augmentation ranges. |
The Model Performance page also lets download a tar archive containing reports and other diagnostics. You typically only need to do this if told to do so by LMI Support.
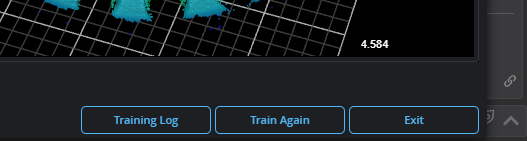
You can also retrain the model with different training configuration if you wish.
You are now ready to use the trained model on new scan data in production.
Deploy in production
Anomaly Tool Setup
| 1. | Connect to the GoMax using a laptop or PC on the same network. |
| 2. | Upload a .gpsup or .gprec file created during the dataset collection. |
Ensure the recording contains the same preprocessing pipeline used during training.
| 3. | Discover the Gocator sensor and create a new sensor group. |
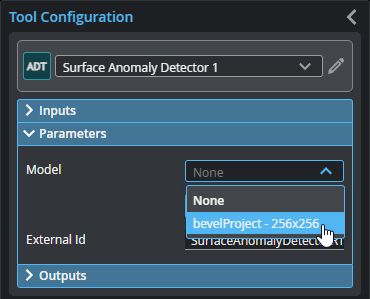
| 4. | Insert the GoPxL Anomaly Detector USB dongle to a USB port on the GoMax. |
| 5. | In the Surface Anomaly Detector tool, in Model, choose the model you trained and want to use in production. |
| 6. | Configure the outputs as required, and implement post-processing to isolate and prepare anomalies for measurement. For more information, see Outputs and Post-Processing . |
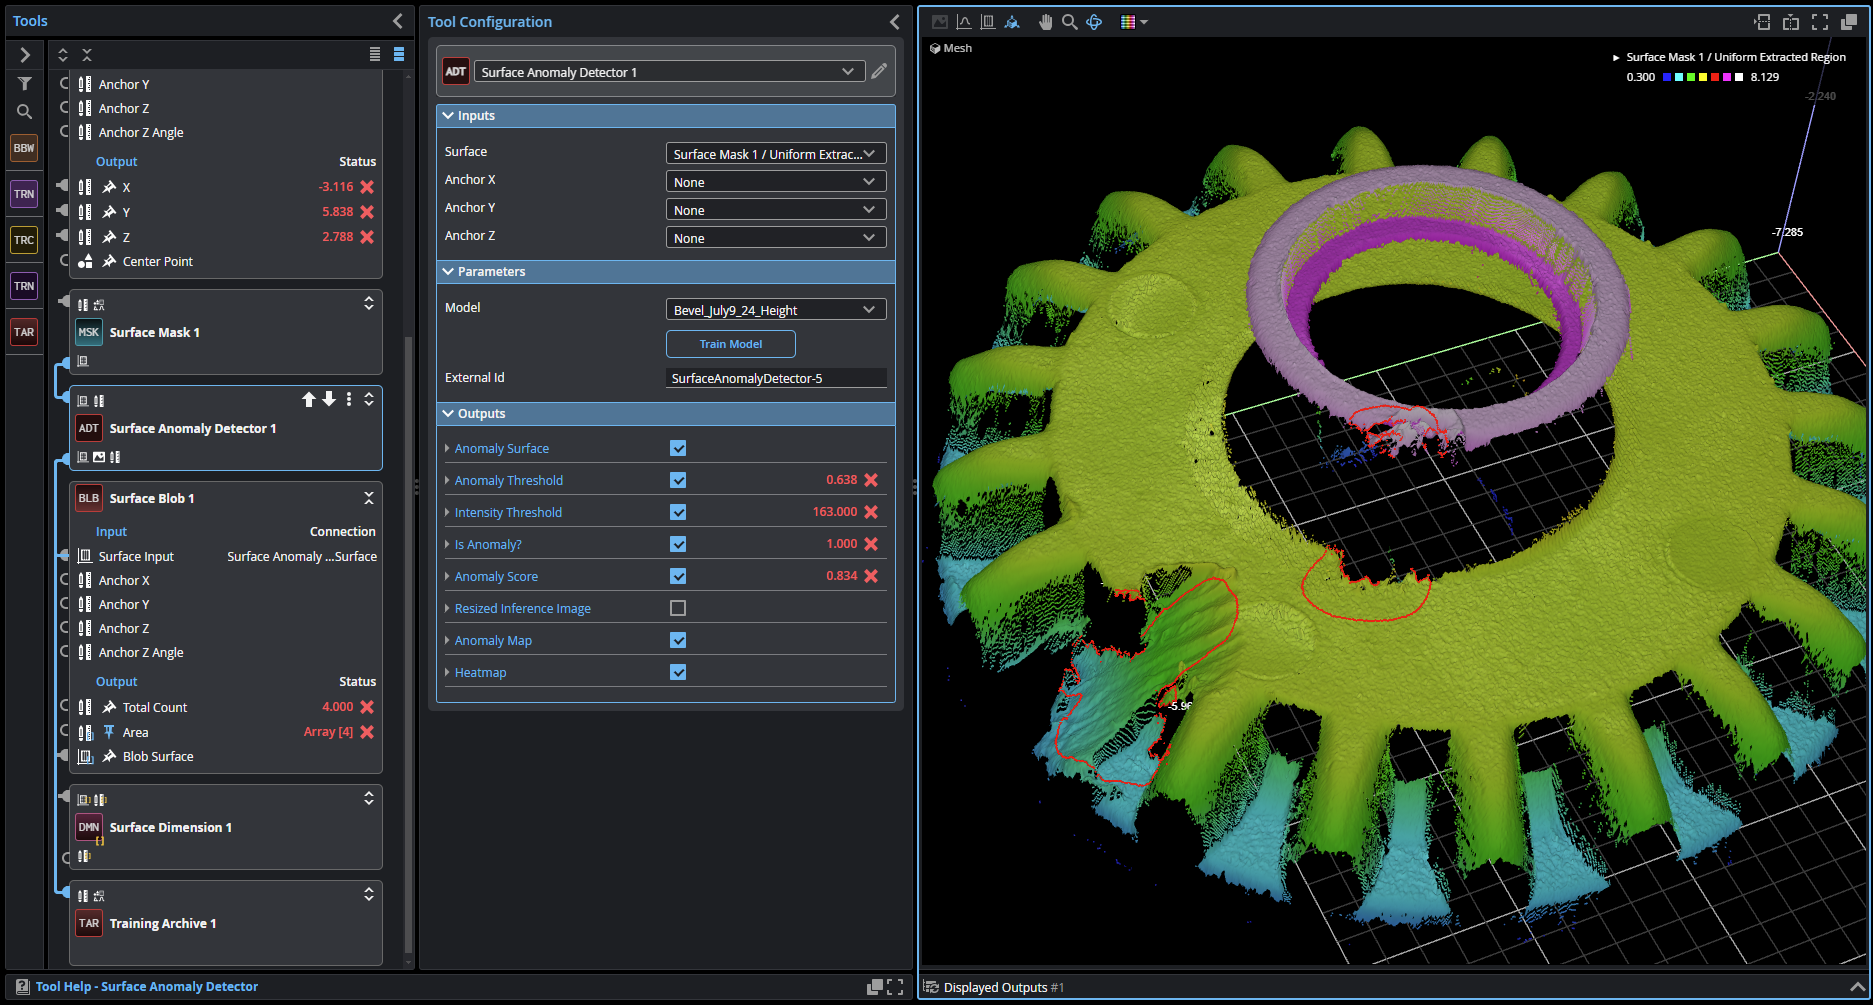
Outputs
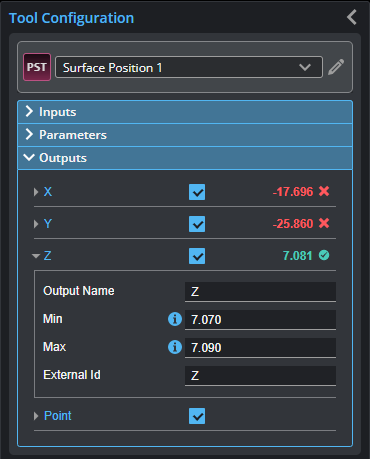
Outputs section with a measurement expanded to show user-configurable decision min/max fields and an external ID
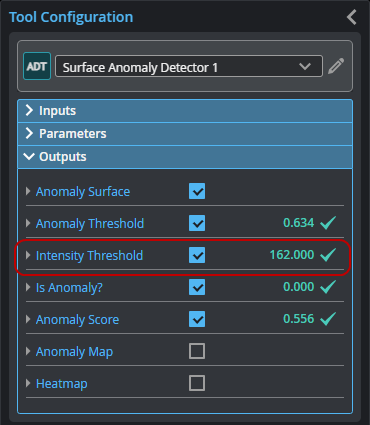
Although the tool has several outputs, the "Is Anomaly" measurement and "Anomaly Surface" output are the main outputs intended for processing by tools later in the tool chain.
You configure the Min and Max parameters by expanding the measurement in the Outputs section. In order for a measurement to return a Pass decision, the measurement must be between maximum and minimum values; the range is inclusive.
| Measurement |
|---|
|
Anomaly Threshold Threshold value (0..1) of the ‘Anomaly Score’ above which the model considers an input surface anomalous. This value is determined during training to achieve the best possible detection rate. |
|
Intensity Threshold A grayscale value in the ‘Anomaly Surface’ intensity data above which the model considers input intensity data anomalous. The value is constant for a trained model. The value is equivalent to ‘Anomaly Threshold’ x 255 and rounded to the nearest integer. |
|
Is Anomaly? Indicates whether the tool has detected an anomaly in the current frame of scan data. |
|
Anomaly Score Indicates how strongly the tool believes the current frame contains an anomaly. When the value is higher than the Anomaly Threshold measurement, this measurement is set to 1.0. |
| Type | Description |
|---|---|
| Anomaly Surface |
Contains the Surface data of the frame, with the anomaly map (see Anomaly Map below) added as intensity data. The intensity data represents a per-pixel score of how anomalous that pixel is. When passed to a segmentation tool such as Surface Blob, the data can be used to locate and measure the size of the anomalies. For more information, see Post-Processing . |
| Anomaly Map |
Diagnostic Image output containing the output anomaly map in the form that is produced by the deep learning inference algorithm. Brighter areas should correspond to flaws. |
| Heatmap | Diagnostic Image output overlaying the Anomaly Map output on the input scan data. This output can make it easier to see whether the brighter areas in the anomaly map correspond with flaws in the target. |
Post-Processing
Typically, you will use a Surface Blob tool to isolate the anomalies on a target and produce Surface data for each, which you can then pass to other tools for measurement.
To isolate anomalies:
| 1. | In the Surface Anomaly Detector tool you added, enable the Intensity Threshold measurement output. |
The Surface Anomaly Detector tool will have defined this value during training and will be used by the Surface Blob tool you will add for post-processing.
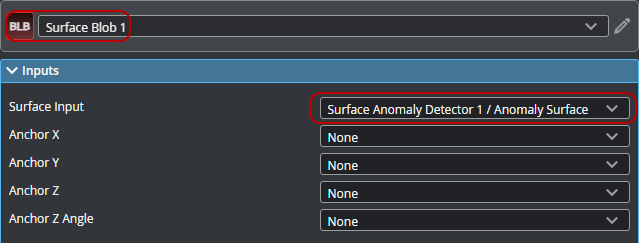
| 2. | Add and connect a Surface Blob tool to the Anomaly Surface output from the Surface Anomaly Detector tool. |
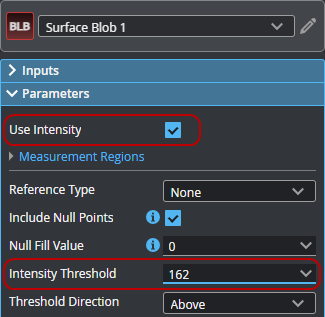
| 3. | In the Surface Blob tool, enable Use Intensity and set the value of Intensity Threshold to the Intensity Threshold output returned by the Surface Anomaly Detector tool. |
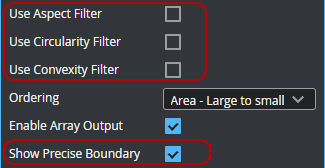
| 4. | Make sure all filters are unchecked to pass all anomalies, and check Show Precise Boundary to display the blob graphics directly on the surface. |
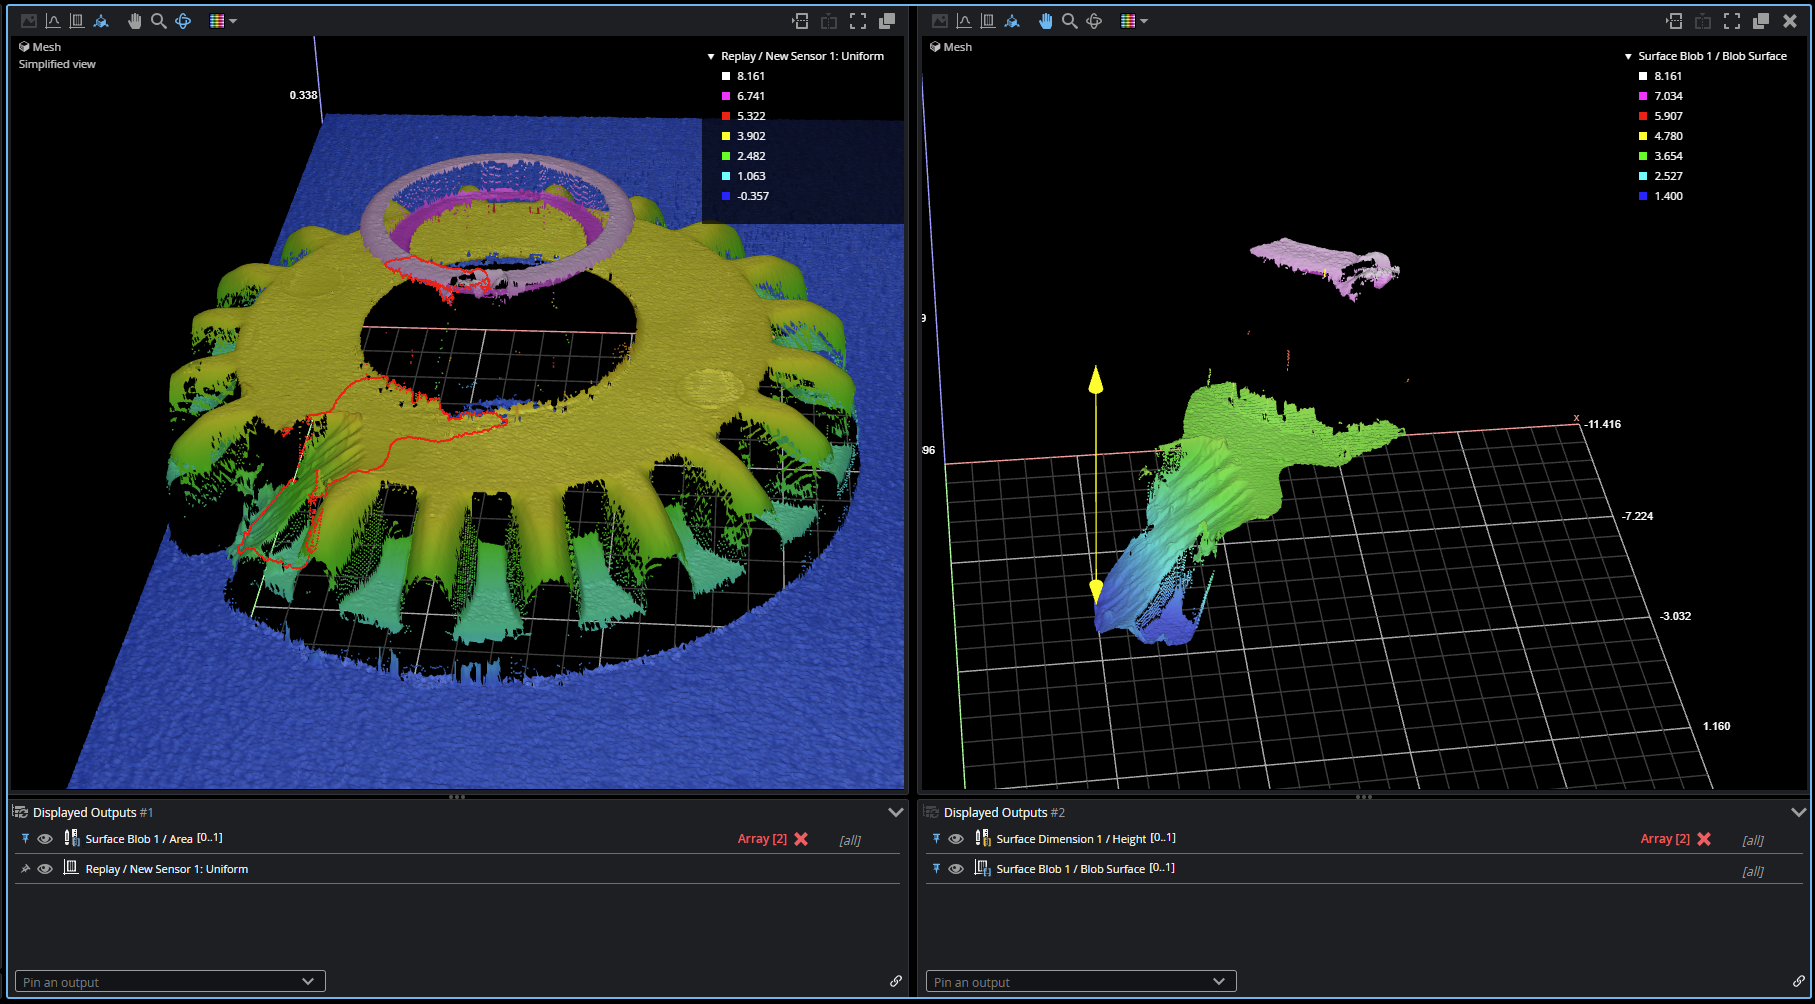
After setting up the Surface Blob tool this way, GoPxL will output the anomalies as Surface data. In the following, the data viewer on the left shows the entire target with the anomaly outlined by the Surface Blob tool. On the right, the anomaly itself is displayed as discrete Surface data.
Store production data
You can use the Training Archive tool to conditionally add frames to a Surface Anomaly Detector project. For more information, see Training Archive.
Train using additional data
After adding new frames to a project using the Training Archive tool (see Training Archive) or uploading additional frames manually (from the replay buffer or from a .gprec file), you can further train the model with new frames, taking advantage of the trained model's prediction capabilities to automatically label frames as OK or NG.
To train using new data:
| 1. | After adding frames to a project, go to the Label Project page. |
| 2. | Select the new frames. |
| 3. | Choose the correct model you want to use for prediction. |
| 4. | At the top of the Frames section, click the Generate Prediction button. |
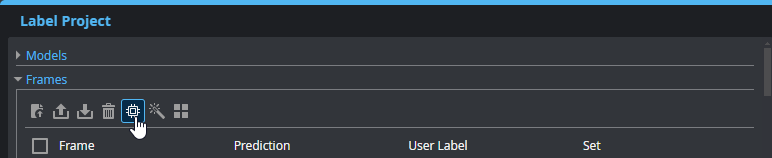
The tool uses the selected model to generate predictions (OK or NG) for the selected, unlabeled frames. Note that the user labels of the frames are unchanged at this point.
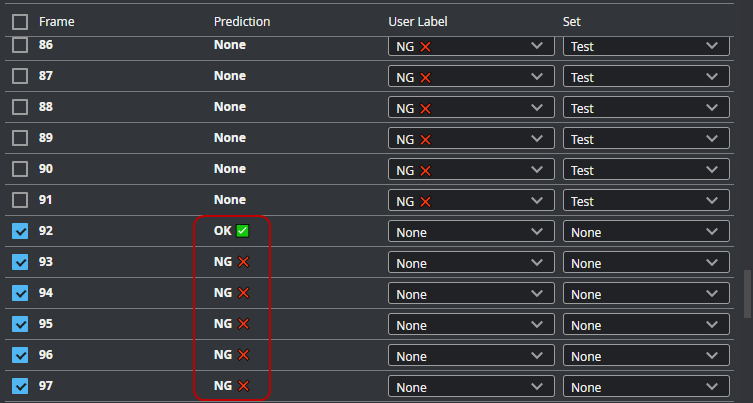
| 5. | Review the predictions and do the following: |
| a. | Uncheck any invalid predictions. |
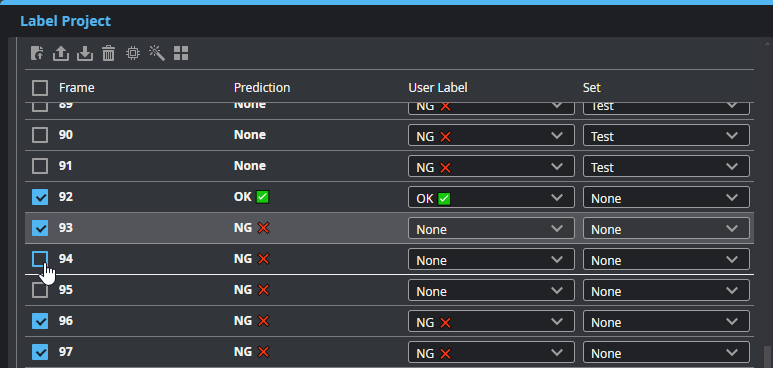
| b. | Click the Apply Prediction button. |
| c. | Toggle Auto-Split to On to automatically set the Set of the selected frames. |
| d. | Manually set the user label of any incorrectly predicted frames. |
The predictions of the selected frames are copied to the user label drop-down.
| 6. | Retrain the model with the newly added frames. |
For more information, see Train Model.