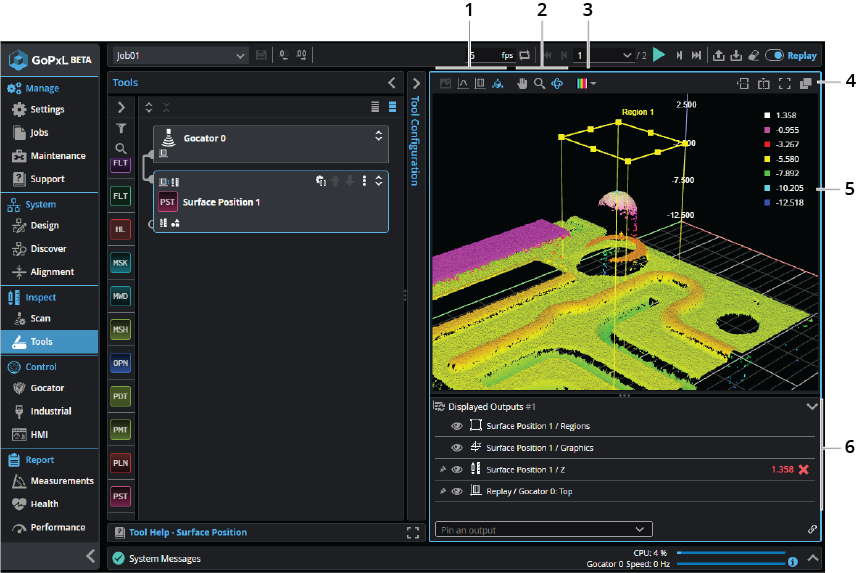
Data Viewer
You use a data viewer to observe scan data (such as Profile and Surface data), as well as video images and intensity images. You can also use it to configure measurement tools (see Tools - Measurement and Processing) and a sensor's active area (see Active Area). GoPxL supports multiple data viewers (via both splitting and pop-out buttons).
| Element | Description | |
|---|---|---|
|
1 |
Use these to change the data viewer's display mode. One of the following:
Image Image mode (
Perspective Perspective mode (
Profile / Front Profile / Front mode (
Surface / Top Surface / Top mode (
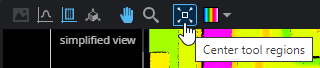
Note that In Surface / Top display mode (and in Profile / Front mode), a center tool region button is available when a tool is selected in the Tools Diagram panel. Clicking this centers any regions in the middle of the data viewer, resizing them to fit. This can be useful when you have zoomed the data viewer in a lot, and need to quickly bring the regions into view.
|
|
| 2 | Pan, zoom, and orbit |
Use these buttons ( Various shortcuts are available to make working with the data viewer easier. For more information, see Keyboard Shortcuts. |
| 3 | Surface display options |
Lets you control how scan data is displayed, such as whether Surface scan data is displayed using a color heightmap or a grayscale heightmap overlay. For information on changing how the data viewer displays Surface data, see Surface and Perspective Display Options. For information on how the data viewer displays Profile data, see Profile Mode.
|
| 4 | Split, zoom, and pop-out |
Use the split buttons (
Use the Pop-out button ( Use the Zoom to fit button ( |
| 5 | Data viewer window |
This is the main window in the GoPxL interface that shows scan data. When you configure tools or set the active area, you can graphically configure the regions in the data viewer window. When the view is zoomed out, to reduce processing, the number of data points that are displayed is reduced, as indicated by "simplified view" in the data viewer. When you zoom in enough, the actual data points are all displayed. |
| 6 | Displayed Outputs pane |
Lets you pin and hide outputs. For more information, see Pinning Outputs. Use the link icon ( |
 ) lets you view pixel data that the system has acquired in Image mode. You should use Image mode to adjust exposure as an initial step and for diagnostics. For more information, see
  ) lets you view data in a 3D perspective representation. You can move and turn the data using a mouse and the pan, orbit, and zoom buttons (
 ). When in orbit mode, hold Shift to temporarily switch to pan mode. The data viewer can display both Surface and Profile data in Perspective display mode. For information on controlling how the data viewer displays Surface data in Perspective mode, see
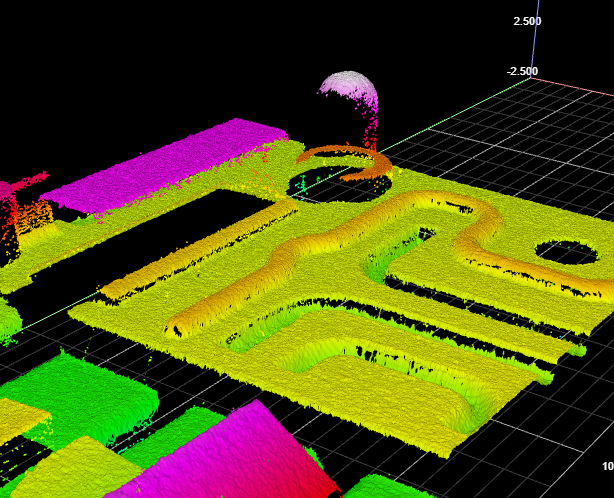
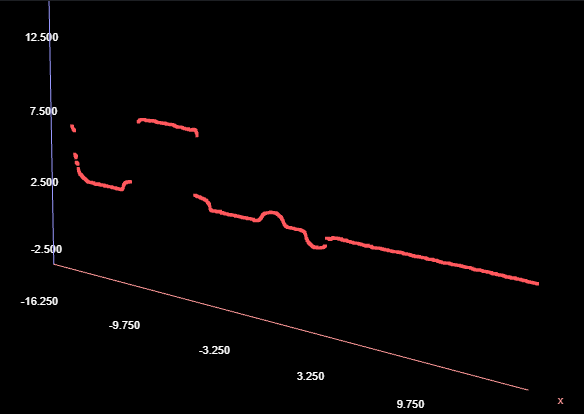
 ) displays profiles in a 2D representation when Profile data is available.
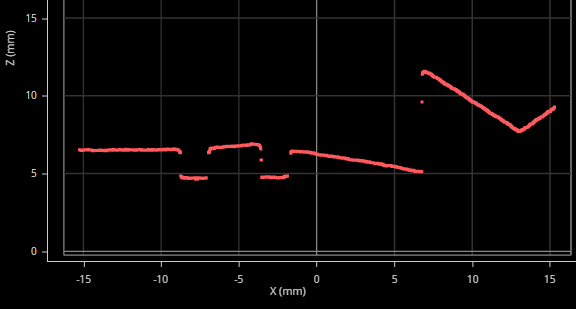
 ) lets you display surface data in a 2D representation when Surface data is available. For information on controlling how the data viewer displays Surface data in Perspective mode, see
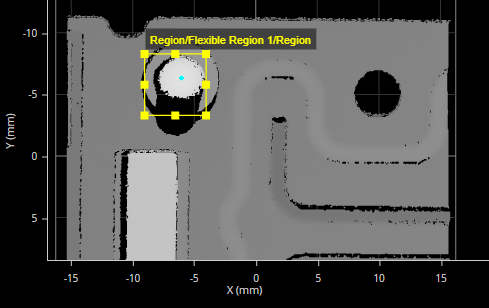
 ) to move scan data in the data viewer with your mouse. (Orbit is only available in the perspective view mode; see above.)
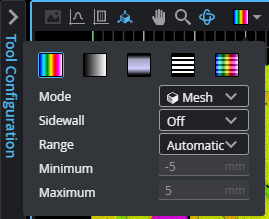
 and
and  ) to create additional data viewers. You can create as many as four data viewers in the main browser window. To close a split window, click its Close icon (
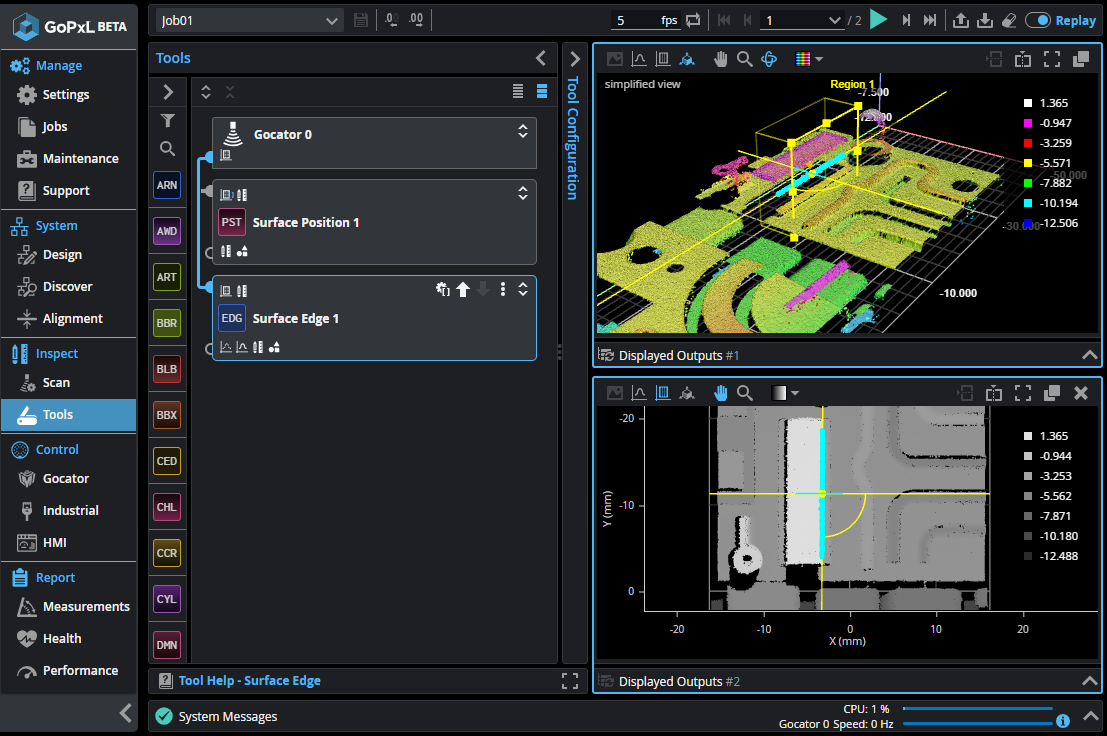
 ) to create a new window with a single data viewer. For more information, see
  ) to zoom the scan data so that it fits in the data viewer window.