Surface Track
The Track tool lets you perform quality control and inspection along a path you define on representative scan data. The Track tool is especially useful for inspecting materials such as glue / sealant beads. The tool returns width and height measurements of the material, as well as OK and NG ("no good") counts, which let you monitor material overflow and breaks. A major advantage of the tool is that it removes the need to configure individual tools for each location along the path. You can use point and line geometric features to anchor the tool (for more information on geometric features, see Geometric Features).

|
Gocator sensors have a limited amount of space for storing path files. For this reason, when working with large datasets, we recommend that you run the Track tool through a PC instance of GoPxL. For more information, see Running GoPxL on a Windows PC. |
| Element | Description | |
|---|---|---|
|
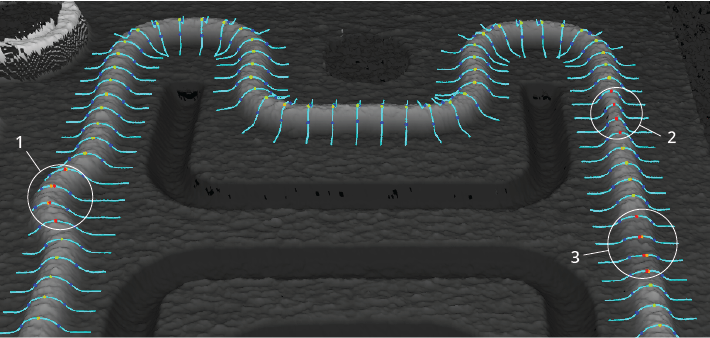
1 |
Offset fails |
The center points in this area of the track are too far off the defined path. |
| 2 | Width fails |
The center points in this area of the track are too narrow. |
| 3 | Height failes |
The center points in this area of the track are too low. (Note how the profiles are flatter than other profiles.) |
You define the path along which the tool performs its measurements using a separate, PC-based utility (the "track editor"). The following shows the relationship between the Surface Track tool and the track editor.

For more information on the track editor, see Track Editor.
|
|
All instances of the Track tool on a sensor or in a PC instance of GoPxL share the same path file set in File (ending in .trk). For this reason, you must be careful when editing or removing path files shared by another instance of the tool. |
For information on adding, managing, and removing tools, as well as detailed descriptions of settings common to most tools, see Tool Configuration.
Key Concepts
The following are important concepts for using both the track editor (see Track Editor) and the Surface Track tool itself:
Track: The material being measured, for example glue or sealant. The material can sit on a flat area on the target, or sit in a groove where the material touches one or both sides.
Path: The ideal center line of the track. You define the path in the track editor. You can define more than one path for use on scanned targets, but the Surface Track tool returns measurements for all paths.
Caliper / ruler: A caliper (in the tool) or ruler (in the track editor) is an area perpendicular to the path you define. You define the size (length and width) and spacing of the rulers in the track editor. The Surface Track tool extracts a profile from the surface data beneath a caliper and performs measurements based on the values you set in the tool's parameters.
Caliper / ruler profiles: The profiles extracted from the surface data under a caliper. The tool's measurements, which are configured using the tool's settings, are applied to these profiles.
Segment: One portion of the path, between points created by clicking on an image of scan data in the track editor. You can choose to configure rulers in segments independently, or choose to configure them in a batch mode.
The following shows a track with calipers. Colored dots provide important information (see below).
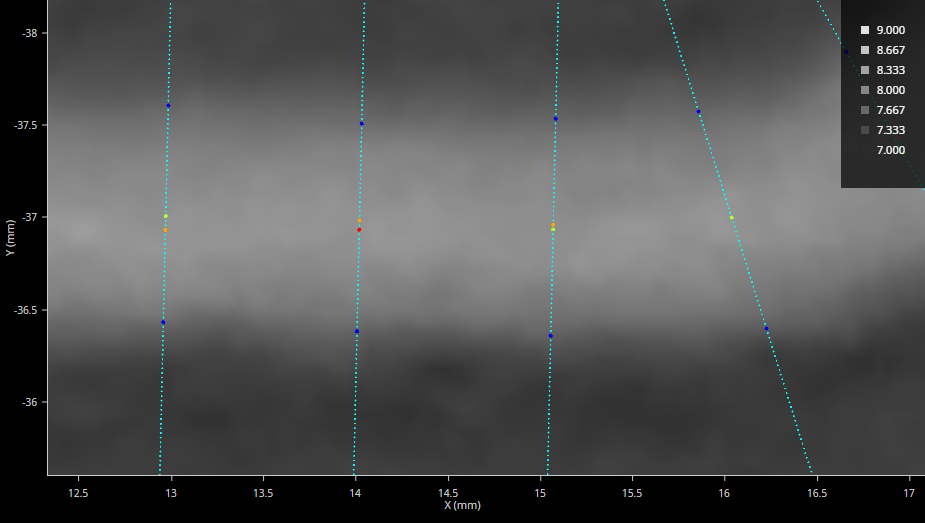
Track tool in data viewer, showing a track (lighter grey horizontal strip in the middle), calipers running perpendicular to the track (light blue dots). Dots of other colors provide additional information (see below).
When you enable Show Measurement Results, the tool displays dots on the calipers to provide the following information (see also the images below):
- Light blue dots: The data points in the caliper profile. When you enable Show Path and Calipers, the tool displays a white line centered on these dots to indicate the location of the caliper.
- Dark blue dotes: The detected sides of the track. These represent the width of the track under that caliper.
- Green dot: The center point (between the two sides of the track) on a caliper that passes all criteria set in the tool. These count toward the "OK Count" measurement.
- Red dots: The center point (between the two sides of the track) on a caliper that fails at least one of the criteria set in the tool. These count toward the "NG Count" measurement. Causes for failures include the width and the height of the track, as well as the area under the caliper profile.
- Orange dots: The peak (highest) point on the ruler. If the center point (green or red) is the same as the peak point, the tool only shows the center point.
Track Location
The tool attempts to locate the track using the profile data it extracts under each caliper, and does this by first locating the "peak" (the highest point on the caliper profile, based on certain criteria) and then locating the side points representing the "sides" of the track.
Peak Detection
The tool determines the peak point on a caliper profile by moving two windows—one to each side of the point being examined—and comparing the average height in those windows with the height of the point being examined. (The size of these windows is specified in Center Window Size.) If the height of the point being examined is greater than both the left and right average height by the value specified in Center Threshold, that point is considered a candidate peak point. The tool uses the candidate point with the highest height over both windows as the peak point.

Side Detection
After the tool has located the peak point, it locates the sides of the track starting from the peak point. You can choose between two methods for side detection: Maximum Gradient and Height Threshold.
Maximum Gradient:
Use this side detection method when the slope of the two sides show a clear drop-off. The following settings define the area in which the tool searches for a maximum gradient, which will determine the edge of the track.
Height Threshold:
Use this side detection method when the slope of two sides is very gradual. The tool finds the left and right edges by averaging the height of small fixed-size windows moving away from the peak point. Edge points are the left-most and right-most window locations where the average height is below a minimum height threshold.
|
Side Height Threshold |
The minimum height that the average calculated in the fixed-width height threshold windows must be below. |
Center Point Detection
The Track tool calculates the center point as the mid point between the left and right side points. This means that the center point may be different from the peak point.
Configuring the Surface Track Tool
To configure the tool, you must first acquire scan data of a representative target; preferably, the material on the target will fall within the expected tolerances. Next, you save the scan data from within the Track tool, and then load the scan data into the track editor. Then, after adding a path or paths, and configuring rulers on the data, you load the track data back into the Track tool. Finally, you configure the tool. For more information on key concepts you need to understand to configure the Track tool, see Key Concepts.
| 1. | Scan a representative target, or load previously scanned data. |
For more information on loading previously scanned data, see Working with Scan Data (Toolbar).
| 2. | Add a Surface Track tool. |
For more information on adding a tool, see Adding a Tool.
| 3. | In the Surface Track tool, choose Create from the Operation drop-down. |
The tool creates a file (for example, SurfaceTrack-0000.trk) containing scan data. Creating the file may take a few seconds.
| 4. | Launch the track editor and configure the path or paths. |
For information on using the track editor, see Track Editor.
| 5. | After you have finished editing the track data in the track editor, in the Surface Track tool, choose Load in the Operation drop-down to load the path data you just created. |
| 6. | Configure the Track tool as required. |
For information on the tool's measurements and settings, see the below.
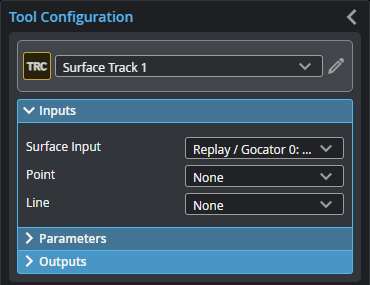
Inputs
You configure the tool's inputs in the expandable Inputs section.
| Name | Description |
|---|---|
|
Surface Input |
The data the tool applies measurements to or processes. |
|
Point Line |
Point and line geometric features (produced by another tool) that you can select as anchors for translation and rotation transformations, respectively. Currently, you must select both in order for anchoring to work. For more information on geometric features, see Geometric Features. |
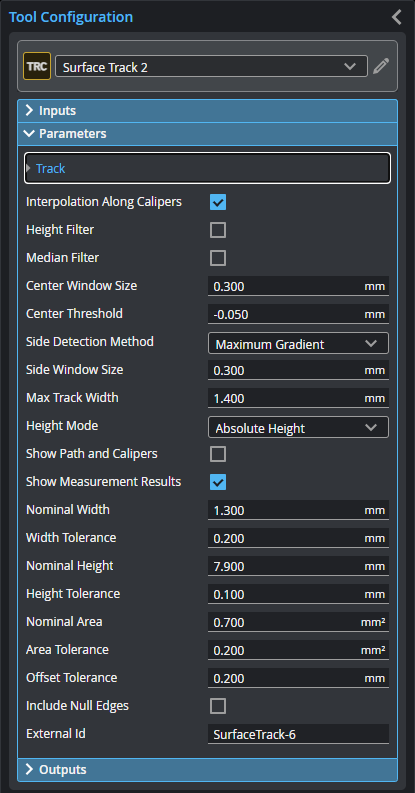
Parameters
You configure the tool's parameters in the expandable Parameters section.
| Parameter | Description |
|---|---|
|
Track |
When expanded, displays file-related operations. |
|
File |
The track file that contains scan and path data. You add paths and calipers to the file using the track editor. For more information on the track editor, see Track Editor. |
|
Operation |
Provides operations related to the track file. One of the following:
|
|
Interpolation Along Calipers |
Enables linear interpolation on the profile extracted from the calipers to achieve sub-pixel accuracy in the width and height measurements. |
|
Height Filter
Dependent settings Threshold High Threshold Low |
When Height Filter is enabled, use the Threshold Low and Threshold High settings to set a range to filter out noise or exclude other undesired data along the caliper profiles. |
|
Median Filter
Dependent settings Window Size |
When Median Filter is enabled, specify the window the tool will use to smooth the height values of the points in the caliper profiles in the Window Size setting. |
|
Center Window Size |
The size of the left and right windows the tool moves along the caliper profile to detect whether the point centered between the two is the highest point along a caliper (the center point). Set this to roughly 50% of the typical width of the track as a starting point. |
|
Center Threshold |
The center point is determined by moving two side-by-side windows (left and right, Center Window Size setting) over each caliper profile. At each point, the height value between the two windows is compared to the average height of the left and right windows. If the center point height is greater, by the amount set in Center Threshold, than the average height in both the left and right windows, that point is considered a candidate center point. The candidate center point with the highest average height over both windows is used as the center point. It may be necessary to use a negative number in some cases, for example, when the top point slightly dips below its surroundings. |
|
Side Detection Method
Dependent settings Side Window Size Max Track Width
Side Height Threshold |
The method the tool uses to detect the two sides of the track. One of the following: Maximum Gradient or Height Threshold. For more information on side detection method settings, see Side Detection. |
|
Determines how height values are interpreted in the tool's Nominal Height setting and what the returned height measurements represent. One of the following: Absolute Height - Height values are interpreted globally (all of the scan data). Step Height - Height values are relative to the surrounding area of the track. |
|
|
Show Path and Calipers |
Displays the path and calipers (as defined in the track editor) on the scan data. |
|
Show Measurement Result |
Shows dots on each caliper representing the results of the measurements on the profile extracted from the surface data under the caliper. For more information, see Key Concepts. |
|
Nominal Width |
The expected width of the track. |
|
Width Tolerance |
The tolerance applied to the nominal width. |
|
Nominal Height |
The expected height of the track. The Height Mode setting determines how the height is interpreted (absolute or step); for more information, see Height Mode. This setting applies to the peak point, not the center point. |
|
Height Tolerance |
The tolerance applied to the nominal height. This setting applies to the peak point, not the center point. |
|
Nominal Area |
The expected cross-sectional area under the calipers on the track. |
|
Area Tolerance |
The tolerance applied to the nominal area. |
|
Offset Tolerance |
The maximum allowed distance between the center (highest) point on a ruler and the path. This setting applies to the center point. |
|
Include Null Edges
Dependent settings Null Fill Value |
When enabled, displays a Null Fill Value parameter you can set to replace null values with the value. |
|
External ID |
The external ID of the tool that appears in GoHMI Designer. For more information, see GoHMI and GoHMI Designer. |
Outputs
Most tools provide measurements, geometric features, or data as outputs.
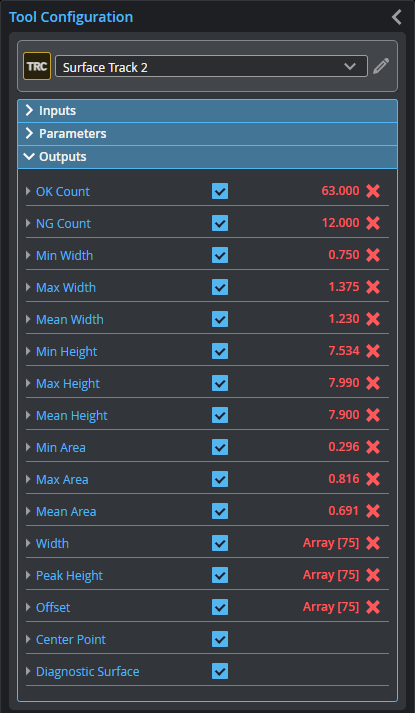
Outputs section with a measurement expanded to show user-configurable decision min/max fields and an external ID
You configure the Min and Max parameters by expanding the measurement in the Outputs section. In order for a measurement to return a Pass decision, the measurement must be between maximum and minimum values; the range is inclusive.
| Measurement | Illustration |
|---|---|
|
OK Count Returns the number of rulers along the path that pass all of the criteria set in the tool's parameters. |
|
|
NG Count Returns the number of rulers along the track path that fail the criteria set in the tool's parameters. (They are "no good.") |
|
|
Min Width Max Width Mean Width These measurements return the minimum, maximum, and mean width of the track. |
Width measurements on a ruler
|
|
Min Height Max Height Mean Height These measurements return the minimum, maximum, and mean height of the track at the center point. When Height Mode is set to Absolute Height, the height returned is the global height. When it is set to Step Height, the height is relative to the surface next to the track. |
Height measurements on a ruler
Height measurements on a ruler
|
|
Min Area Max Area Mean Area These measurements return the minimum, maximum, and mean area under the rulers. |
Area measurements under a |
|
Width Peak Height Offset Arrays containing the widths, peak heights, and offsets of each ruler. |


| Type | Description |
|---|---|
| Center Point |
An array of Point geometric feature representing the center point of each ruler. |
|
|
For more information on geometric features, see Geometric Features. |
| Type | Description |
|---|---|
|
Diagnostic Surface |
Surface data created by combining the extracted profiles. Use for diagnostics. |