Data Viewer
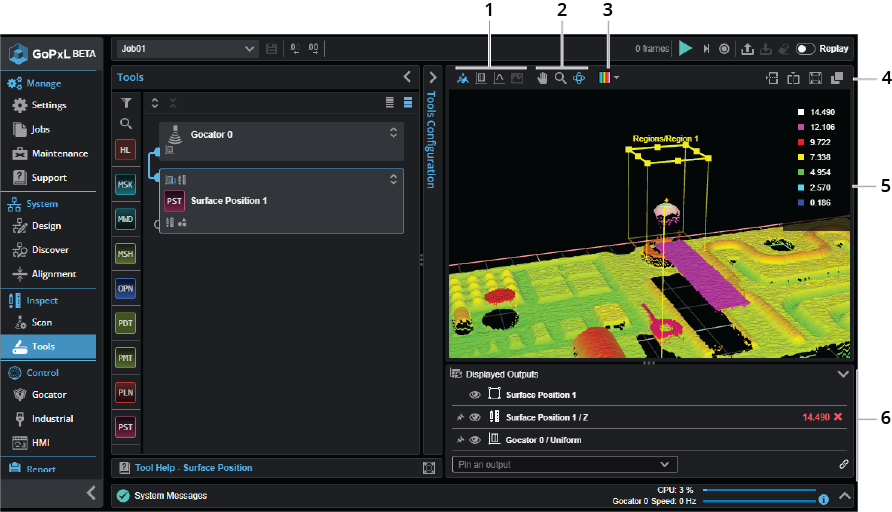
You use a data viewer to observe scan data (such as Profile and Surface data), as well as video images and intensity images. You can also use it to configure measurement tools (see Configuring Inspection and Processing Tools) and a sensor's active area (see Active Area). GoPxL supports multiple data viewers (via both splitting and pop-out buttons).
| Element | Description | |
|---|---|---|
|
1 |
Use these to change the data viewer's display mode. One of the following:
Perspective Perspective mode (
Profile / Front Profile / Front mode (
Surface / Top Surface / Top mode (
Image Image mode ( |
|
| 2 | Pan, zoom, and orbit |
Use these buttons ( |
| 3 | Surface display options |
Lets you control how scan data is displayed (such as whether Surface scan data is displayed using a color heightmap or a grayscale heightmap overlay, or the color of a profile. For information on changing how the data viewer displays Surface data, see Surface and Perspective Display Options. For information on how the data viewer displays Profile data, see Profile Mode.
|
| 4 | Split, zoom, and pop-out |
Use the split buttons (
Use the Pop-out button ( Use the Zoom to fit button ( |
| 5 | Data viewer window |
This is the main window in the GoPxL interface that shows scan data. When you configure tools or set the active area, you can graphically configure the regions in the data viewer window. |
| 6 | Displayed Outputs pane |
Lets you pin and hide outputs. For more information, see Pinning Outputs. Use the link icon ( |
 ) lets you view data in a 3D perspective representation. You can move and turn the data using a mouse and the pan, orbit, and zoom buttons (
 ). When in orbit mode, hold Shift to temporarily switch to pan mode. The data viewer can display both Surface and Profile data in Perspective display mode. For information on controlling how the data viewer displays Surface data in Perspective mode, see
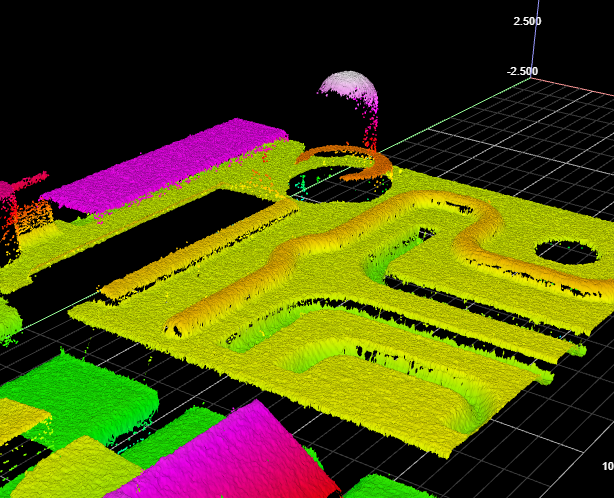
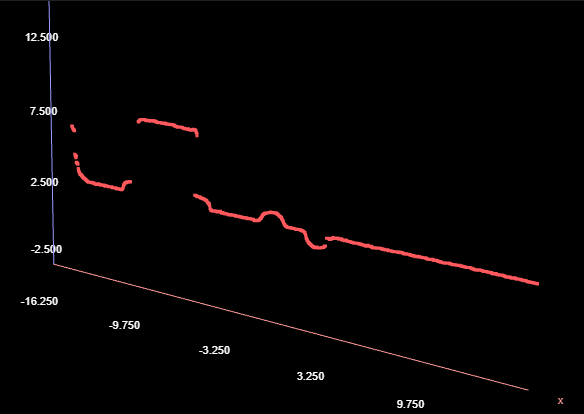
 ) displays profiles in a 2D representation when Profile data is available.
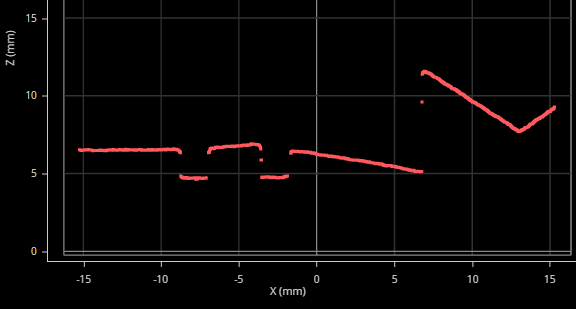
 ) lets you display surface data in a 2D representation when Surface data is available. For information on controlling how the data viewer displays Surface data in Perspective mode, see
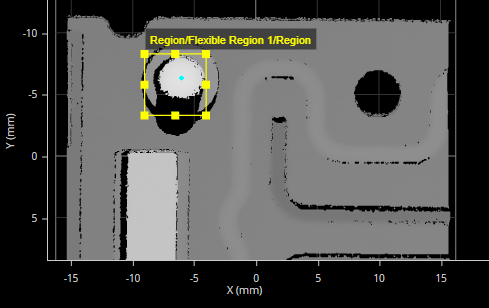
 ) lets you view pixel data that the system has acquired in Image mode. Useful for adjusting exposure and diagnostics.
 ) to move scan data in the data viewer with your mouse. (Orbit is only available in the perspective view mode; see above.)
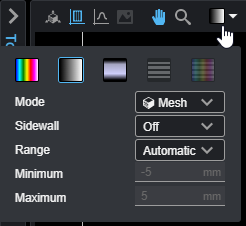
 and
and  ) to create additional data viewers. You can create as many as four data viewers in the main browser window.
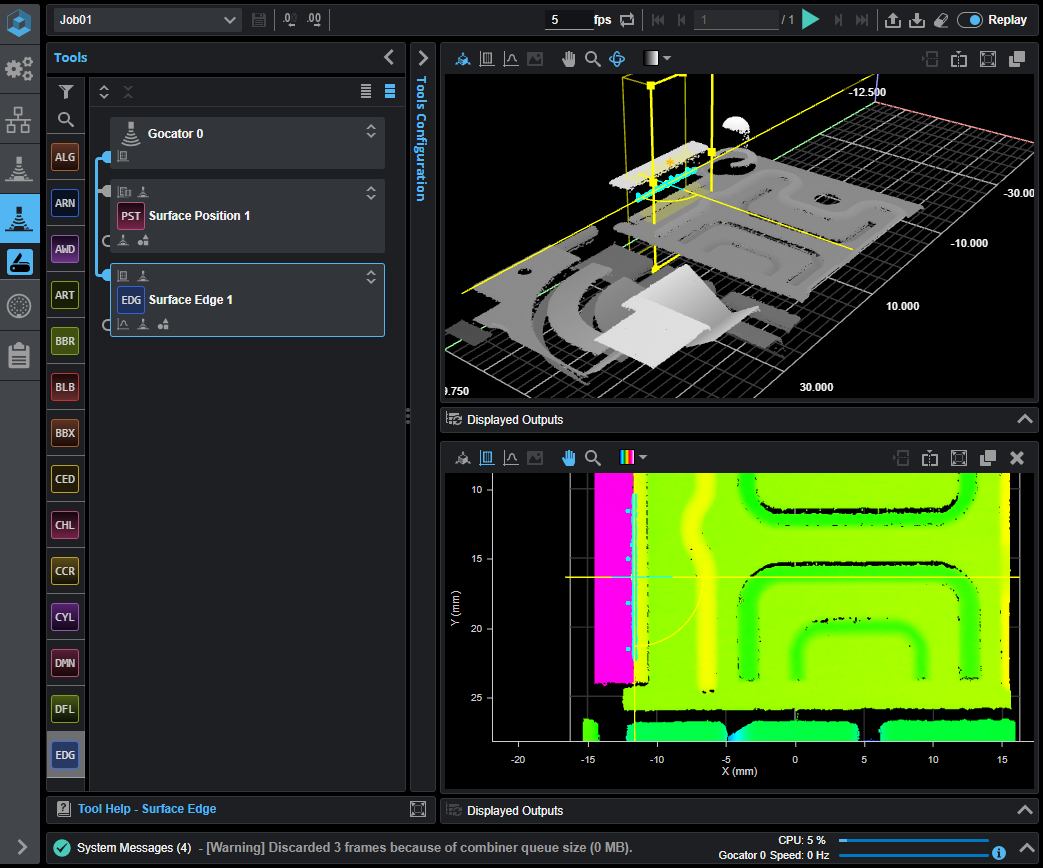
 ) to create a new window with a single data viewer. For more information, see
  ) to zoom the scan data so that it fits in the data viewer window.